EOS, Cosmos, Dogecoin Price Analysis: 11 March

EOS formed a bullish pattern and could get a leg upwards to $4.4 upon breakout. Cosmos was unable to breach the $21.3-level of resistance, but buying volume was slowly climbing. Finally, Dogecoin was trading above the $0.054-level following a rejection at $0.06 once more.
EOS
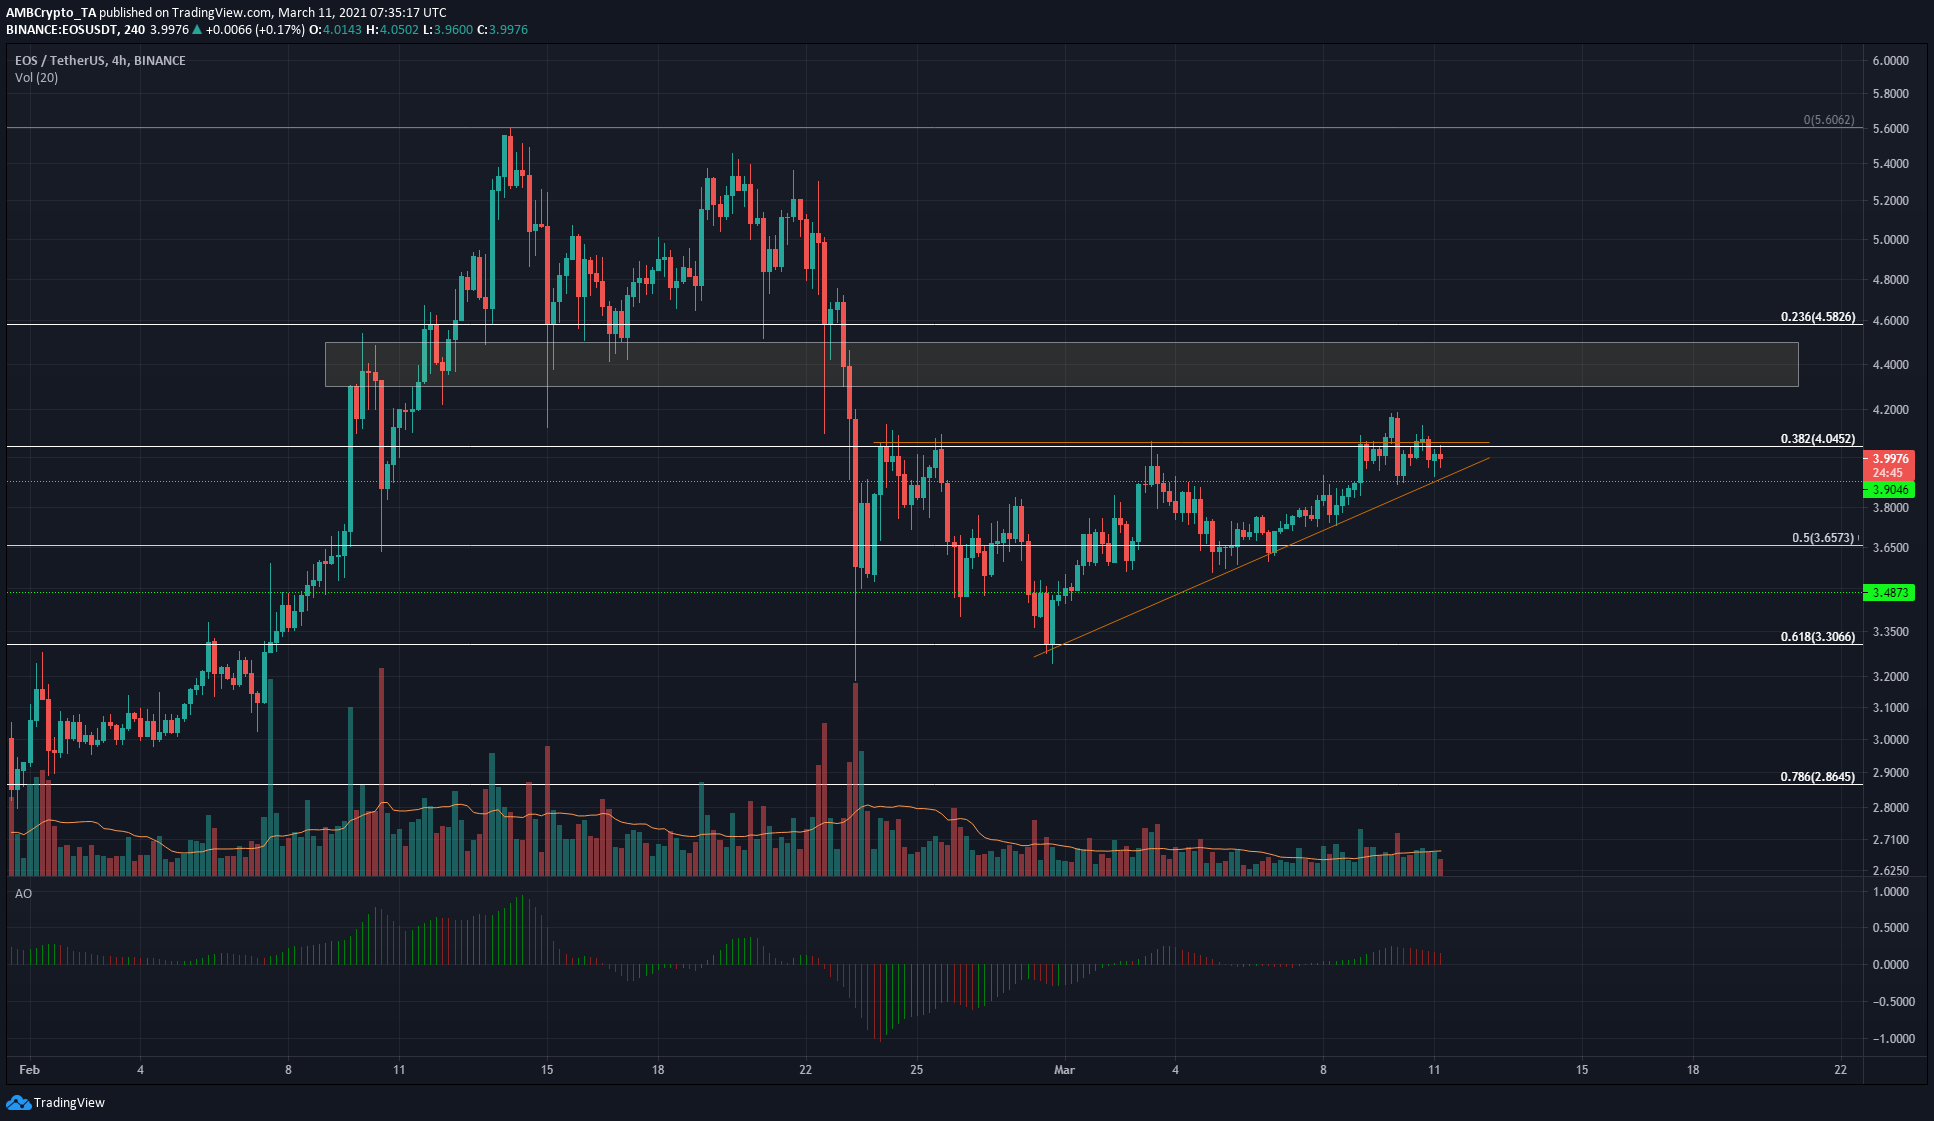
EOS formed an ascending triangle pattern on the charts, and in the time the price was within the pattern, the trading volume was also trending downwards. This suggested that a breakout was likely imminent, although a close outside the pattern backed by heavy volume would determine the direction of the move.
Just above $4 lay a region of supply in the vicinity of $4.4, making it a take-profit area upon breakout. Closing below the $3.9-level would see EOS visit the $3.65-level. The Awesome Oscillator was above zero while a crossover under the half-line can be used to lend evidence to a breakdown.
Cosmos [ATOM]
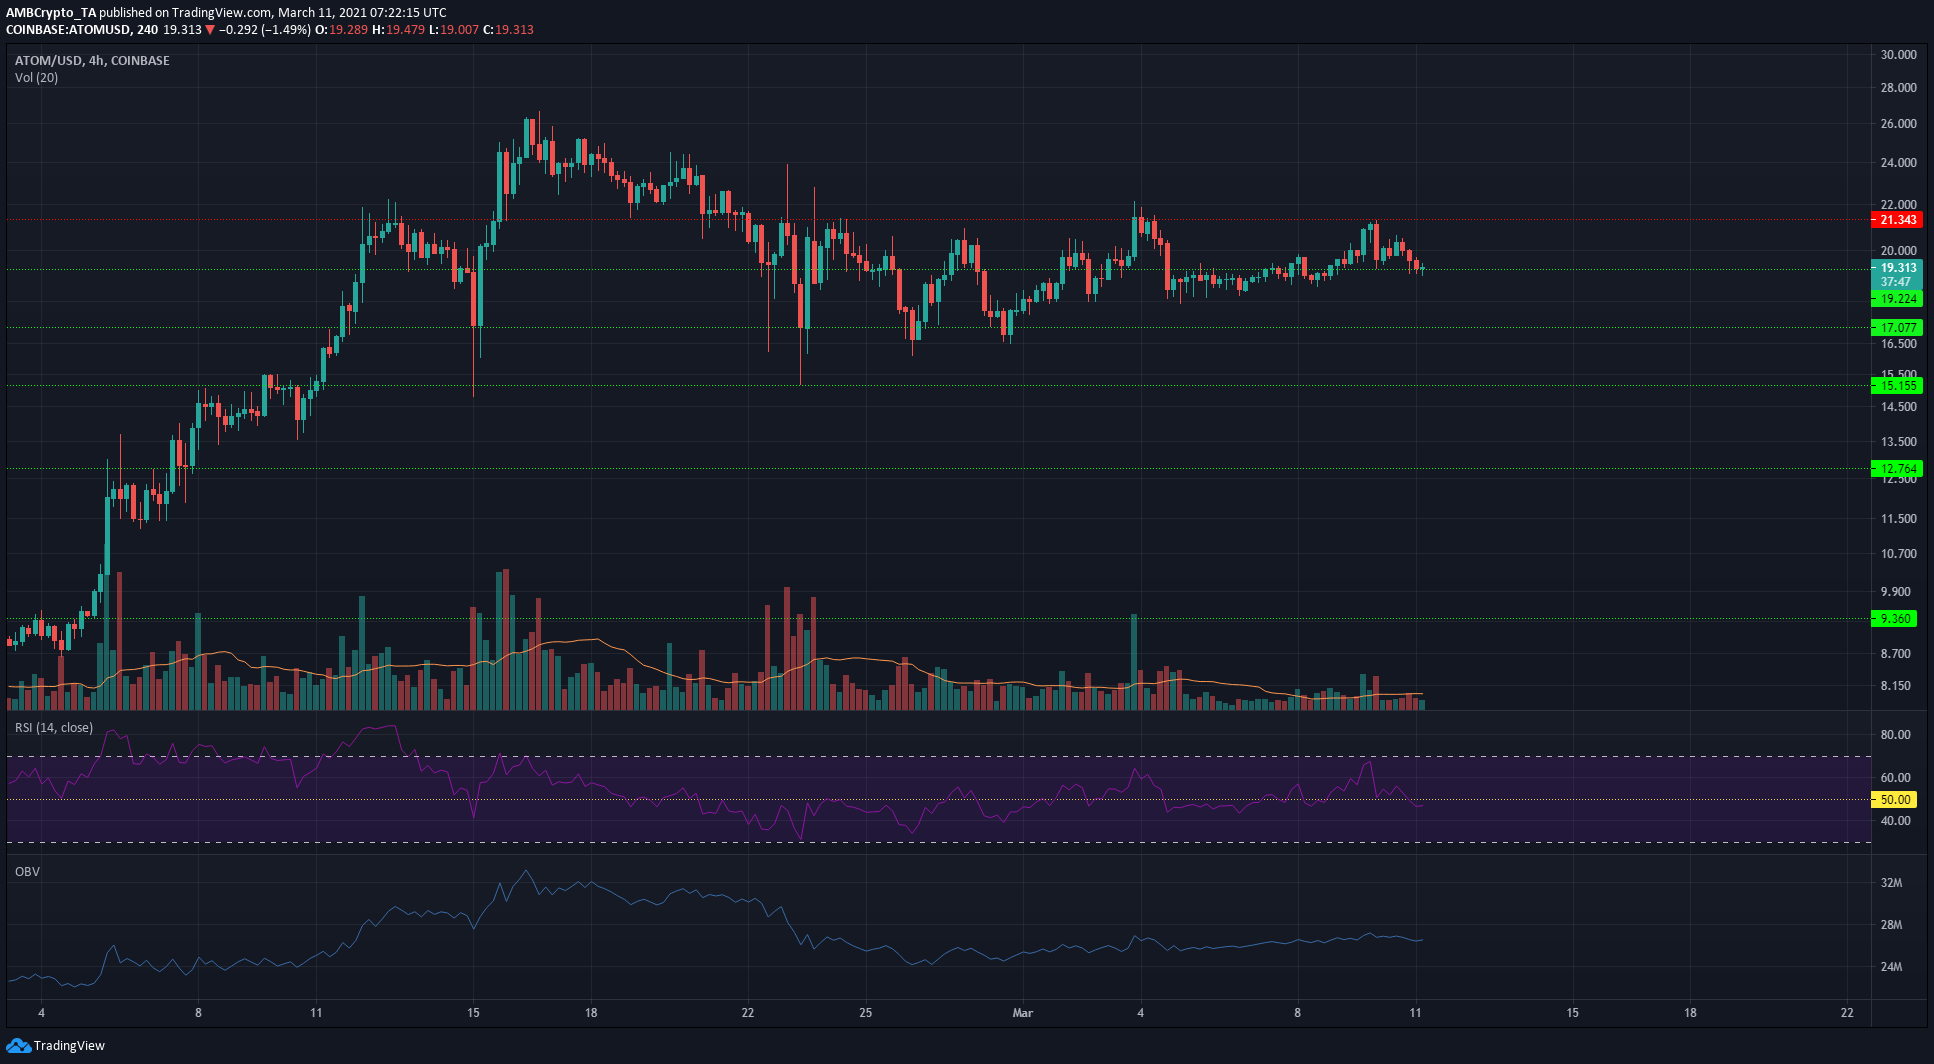
ATOM did not see a definite direction to its price movement over the past three weeks. It faced stiff resistance at the $21.3-level, while also testing the $17-level of support repeatedly over the same period.
In fact, the past week saw the market’s bulls regain a little bit of control in the market as they slowly pushed the price higher to flip $19.2 to support. The OBV was gently trending north, underlining the fact that buyers were only slightly stronger.
The RSI dipped below 50 on the 4-hour chart. A session close under $19.22 would see a dip to $18.3 and lower. A long position can be entered on a retest of the $19.22-level, provided sellers haven’t taken control over the lower timeframes.
Dogecoin [DOGE]
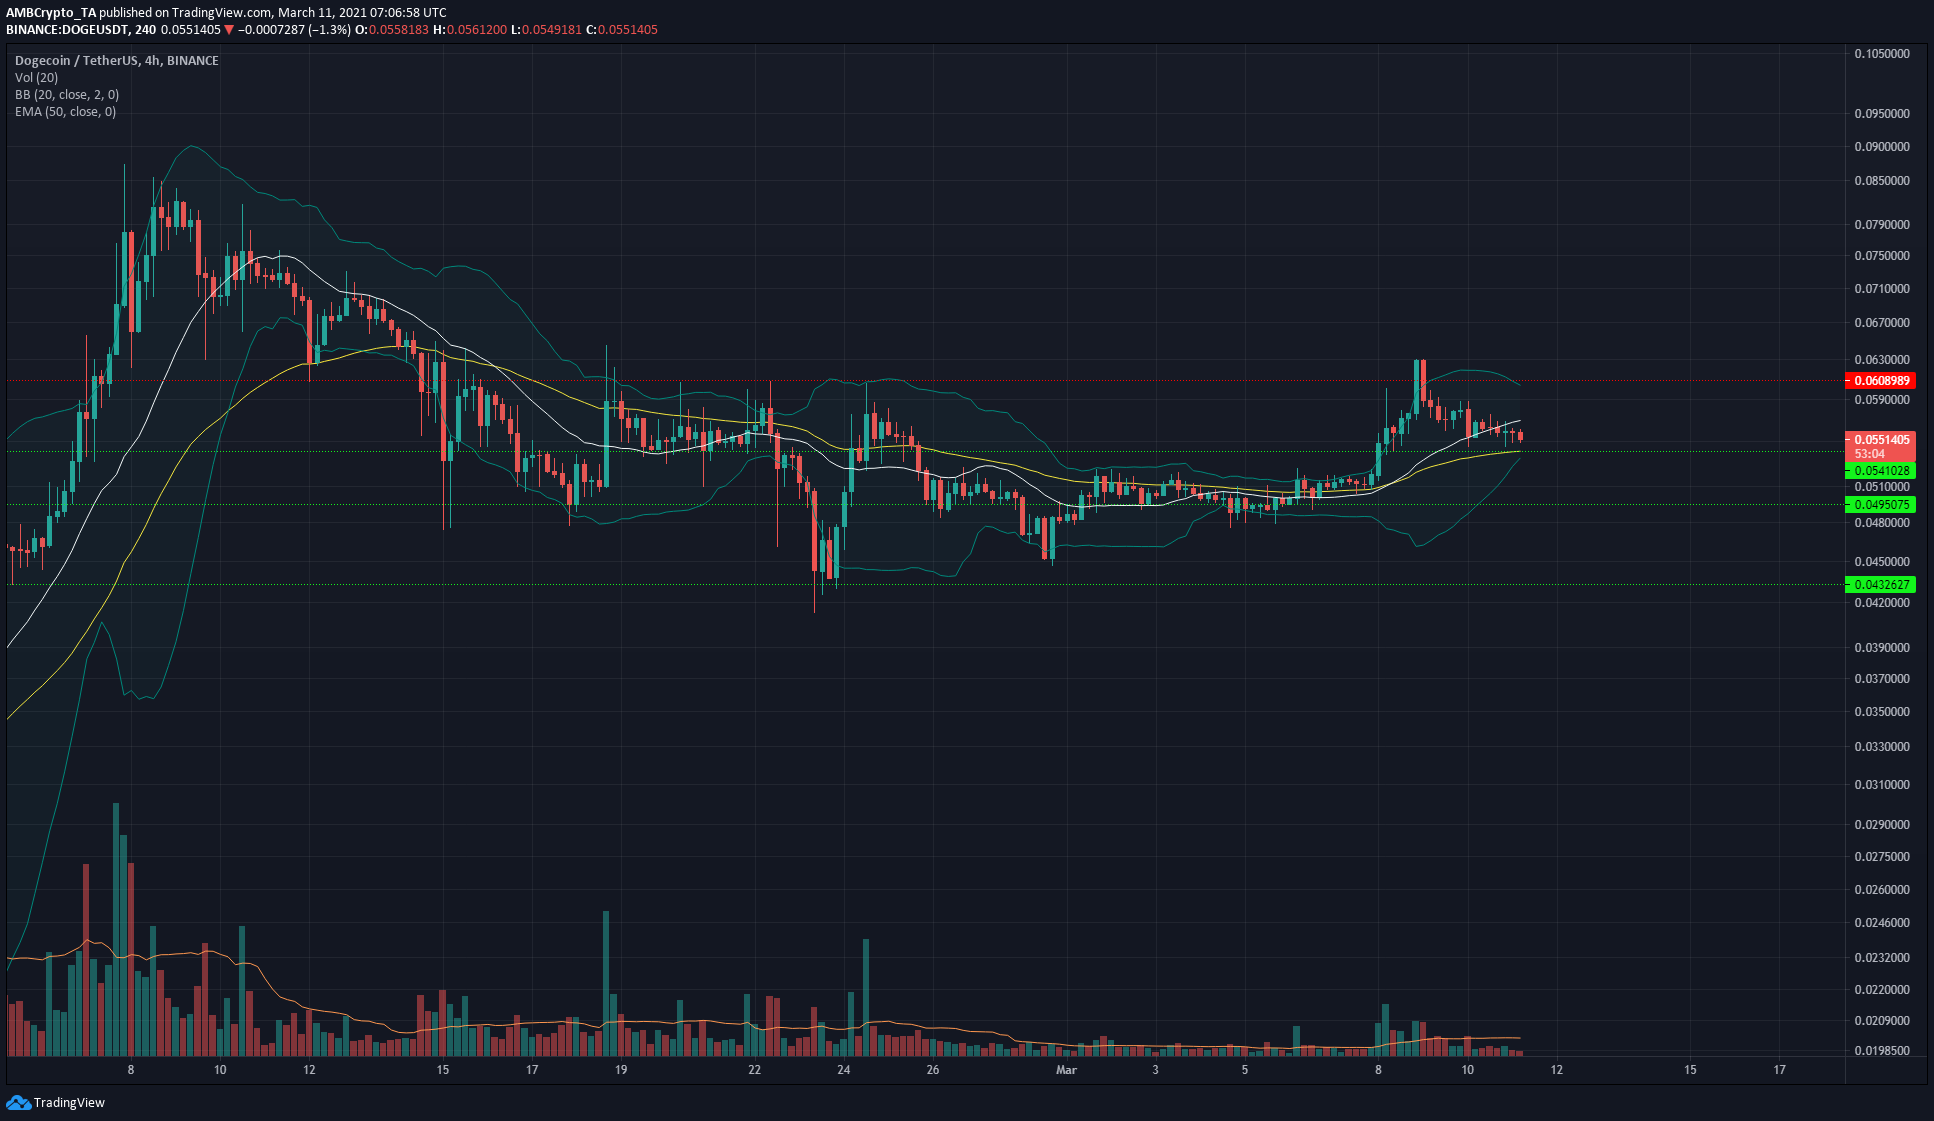
In the first week of March, DOGE appeared to be in a phase of consolidation above the $0.0495-mark. On the 4-hour chart, the Bollinger Bands began to tighten around the price. A few days ago, DOGE saw a move upwards to $0.06, with the alt briefly rising above it to touch $0.062, before sellers pushed the price down by close to 12%.
The $0.06, $0.054, and $0.049-levels will be levels of importance over the next few days. The price, at press time, was above the 50-period EMA (yellow). If buyers can defend this level, DOGE could see head north again, especially if Bitcoin sees some gains as well.