ETC holders trading without system can consider these metrics

Ethereum Classic [ETC] may be on its way to another triple-digit gain. About two weeks back, the six-year-old cryptocurrency hit a three-digit profit within one week. During that time, ETC jumped a whopping 106.21%, increasing from $13.65 on 16 July to $27.12 on 23 July.
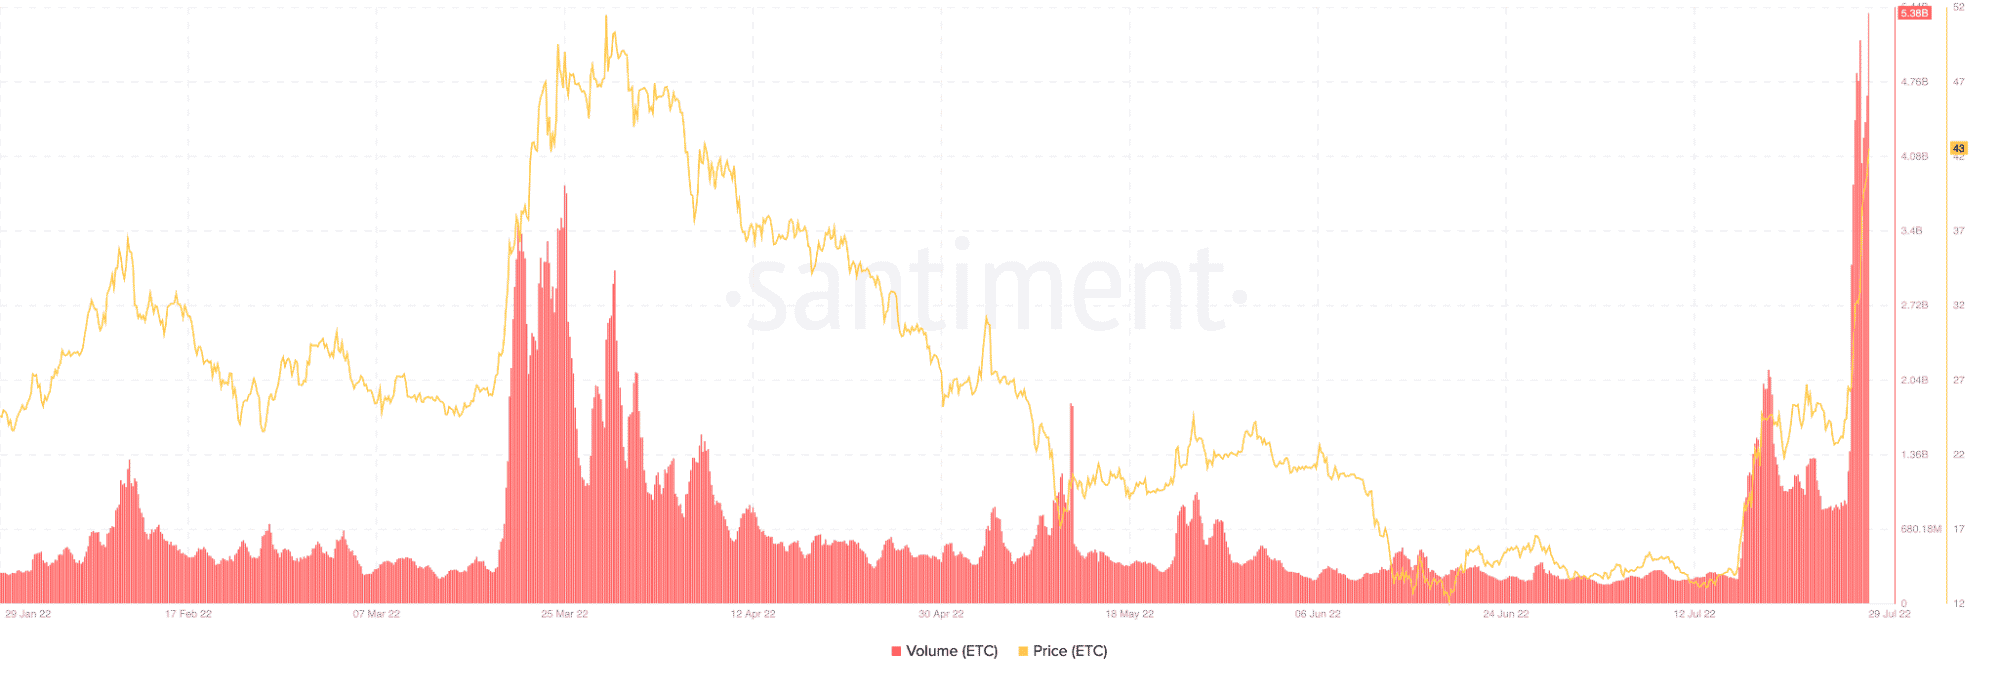
Despite a brief retrace to $23.42 on 26 July, ETC, at press time, was back to a non-stop rally. Over the last 24 hours, ETC had made 35.45% profits for its investors at the time of writing. This is coming after it had experienced exponential growth and realized another 134% profits over the last few days.
The new level meant ETC is past its previous bullish level and could prove too strong for naysayers.
What’s the catch?
The tremendous rise of ETC has been due to a couple of factors. On the technical outlook, the Fibonacci resistance projection seemed to be accurate. Additionally, ETC has made giant strides in terms of several metrics.
First, the volume entering the ETC ecosystem had been massive over the last 24 hours, even on 27 July. According to data from Santiment, ETC’s volume as of 26 July was 895.31 million. At press time, it had increased to an incredible 5.38 billion.
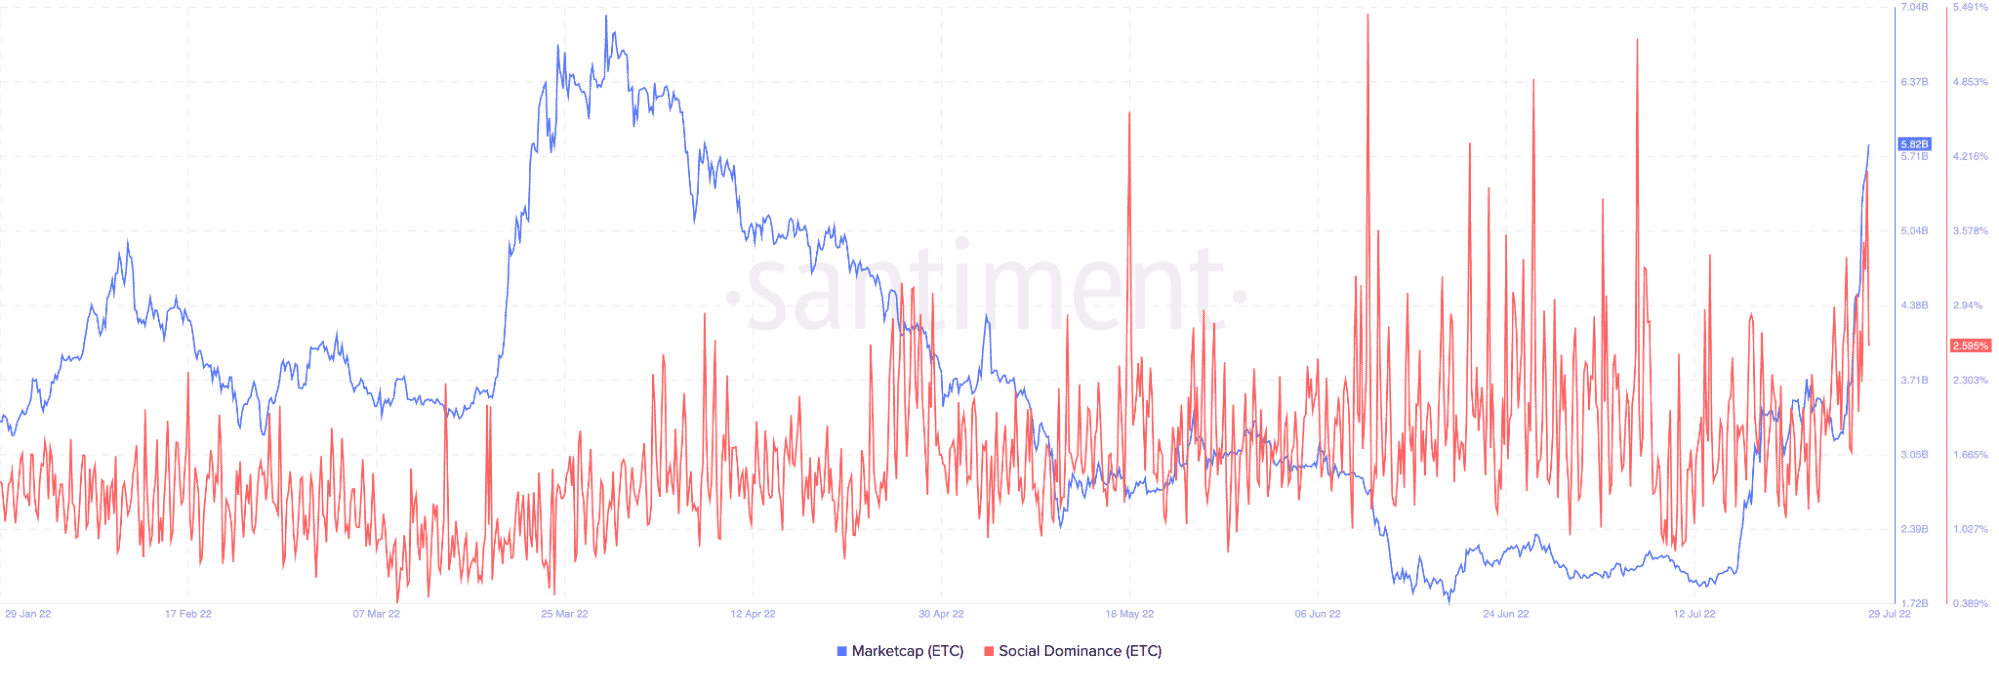
The market cap worth $1.54 billion on 26 July was $5.82 billion at the time of this writing. Similarly, the social volume had peaked at over 4% within the last 24 hours, indicating that the ETC rally was no fluke.
Apart from these factors, one other overlooked cause could have played a vital role in driving ETC up the charts.
The Vitalik push
Earlier, Ethereum [ETH] founder Vitalik Buterin mentioned that he loved the Proof-of-Work (PoW) chain backing the ETC network. With the Proof-of-Stake (PoS) Merge coming up in September, Vitalik noted that ETC might remain functional within the ETH chain.
Despite the claim, ETC had performed exceptionally well over its peers in the smart contracts ecosystem. ETH gained around 6%, and BNB increased 3.07%. The closest to ETC was Solana [SOL] which registered a 9.65% gain.
Moving forward
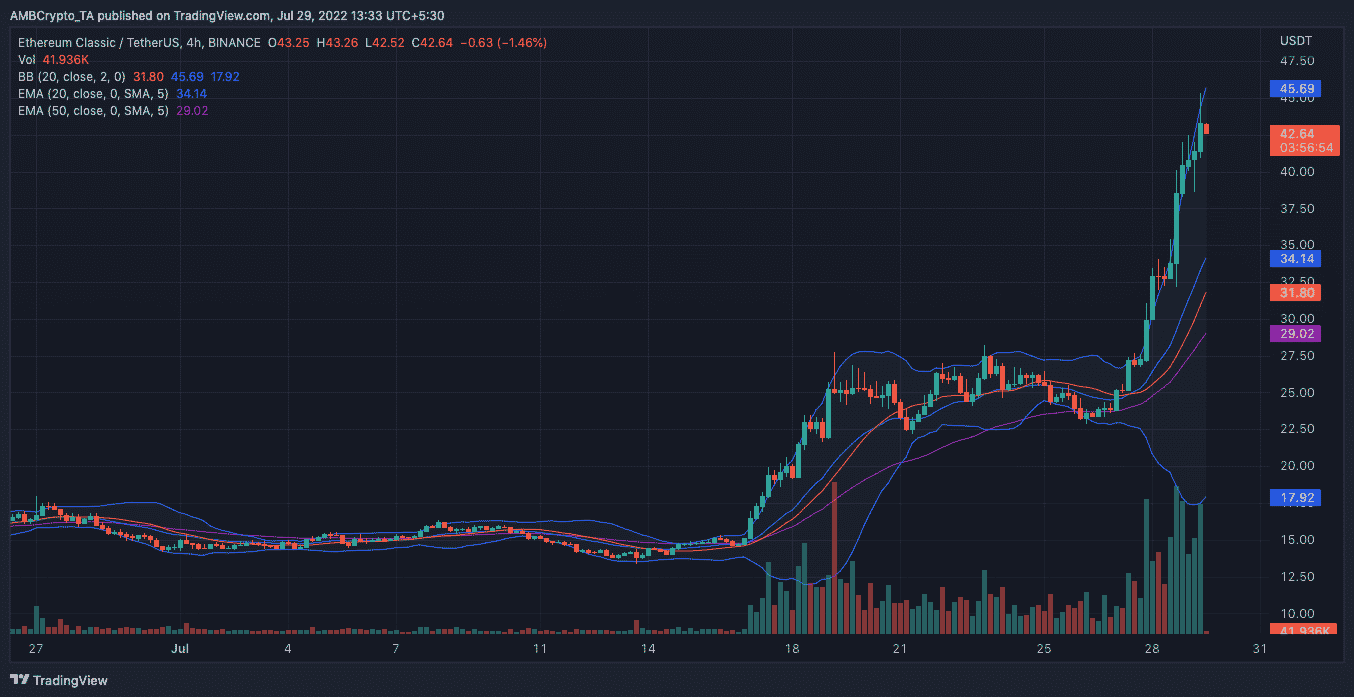
As it stands, the overall market sentiment indicates that the bull run of ETC might not be over. However, the Bollinger Bands (BB) showed extreme volatility, which could lead to a reversal.
On the other hand, the 20 EMA (blue) and 50 EMA (purple) showed opposite results to the BB in the short term.
At press time, the 20 EMA was comfortably above the 50 EMA. A closer look at the four-hour chart revealed that investors might be currently taking profits as it seemed that the selling pressure had increased.


