ETH has a bullish structure but aggressive profit taking could be key for bulls

Disclaimer: The findings of the following analysis are the sole opinions of the writer and should not be considered investment advice
- Ethereum has a bullish market structure
- Yet, buying pressure and momentum were not strong enough to indicate a rally was imminent
The Ethereum merge occurred almost three months ago on 15 September. Since then ETH was unable to break above the $1,650 resistance. The on-chain metrics did not favor the bulls either. The past month saw losses amounting to around 20% at press time, from $1646 to $1264.
Read Ethereum’s Price Prediction 2023-2024
Ethereum bulls would need to be wary in the coming days. Strong buying pressure was not yet evident, and Bitcoin also faced resistance near $17.3k and $17.6k. A move above $1360 would be needed before buyers can justify their conviction in the coming weeks.
Breakers on either side give hints of where Ethereum can find a large volume of buyers and sellers
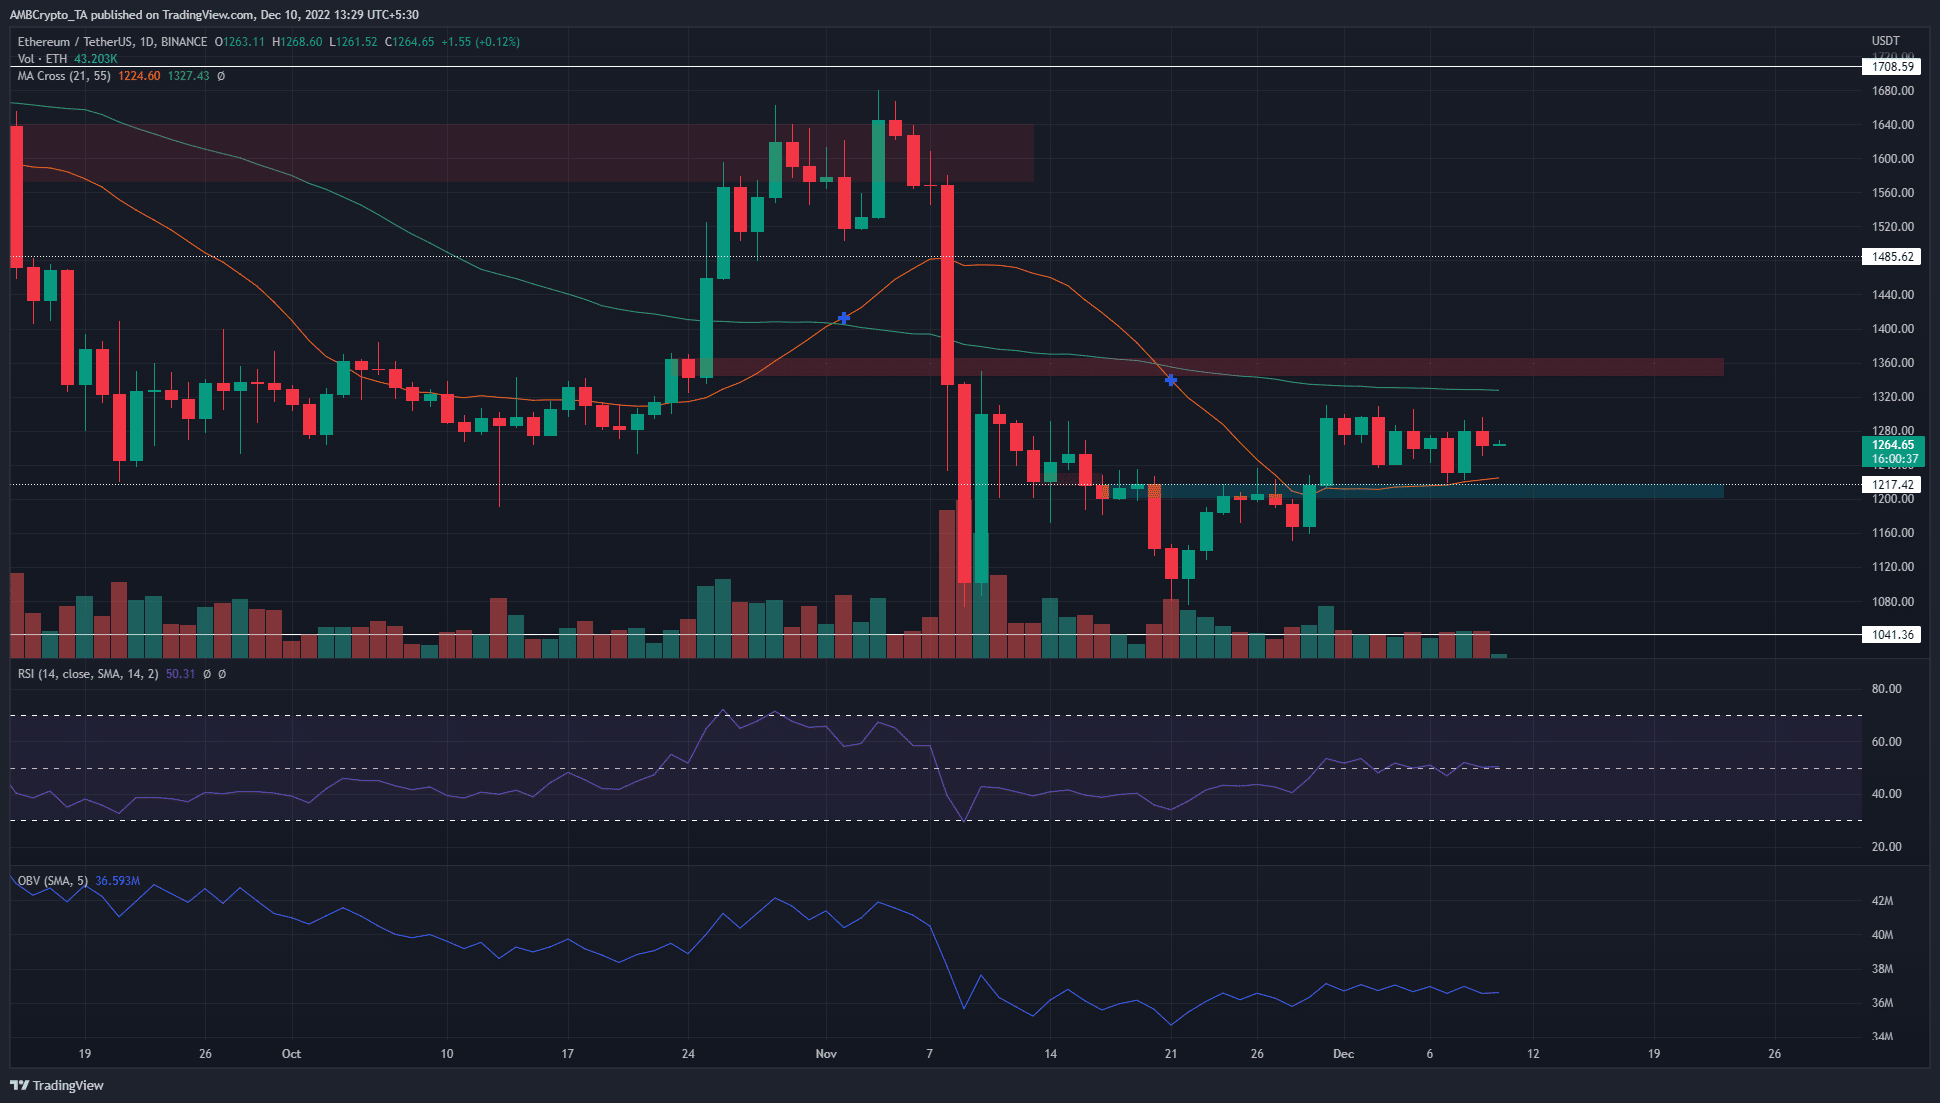
Two breakers were formed over the past six weeks in the $1,360 and the $1,200 zone. Highlighted in cyan and red, they are bullish and bearish breakers respectively. They had formerly been bearish and bullish order blocks but the price has broken past them since then.
At the time of writing, ETH possessed neutral momentum on the daily timeframe. The Relative Strength Index (RSI) was at a neutral 50 while the 21 and 55-period moving averages showed bearish momentum for ETH. However, the market structure was bullish. This happened on 30 November when the price broke above the $1217 level. In doing so it breached the series of lower highs the price has set since 9 November.
The On-Balance Volume (OBV) was also flat since mid-November and showed buying pressure was not yet behind Ethereum. Until this changes, traders can look to sell ETH at $1360 and buy it on a retest of $1217. The $1300-$1315 area also offers resistance on the lower timeframes.
The funding rate slips below 0 but withdrawal transactions show accumulation
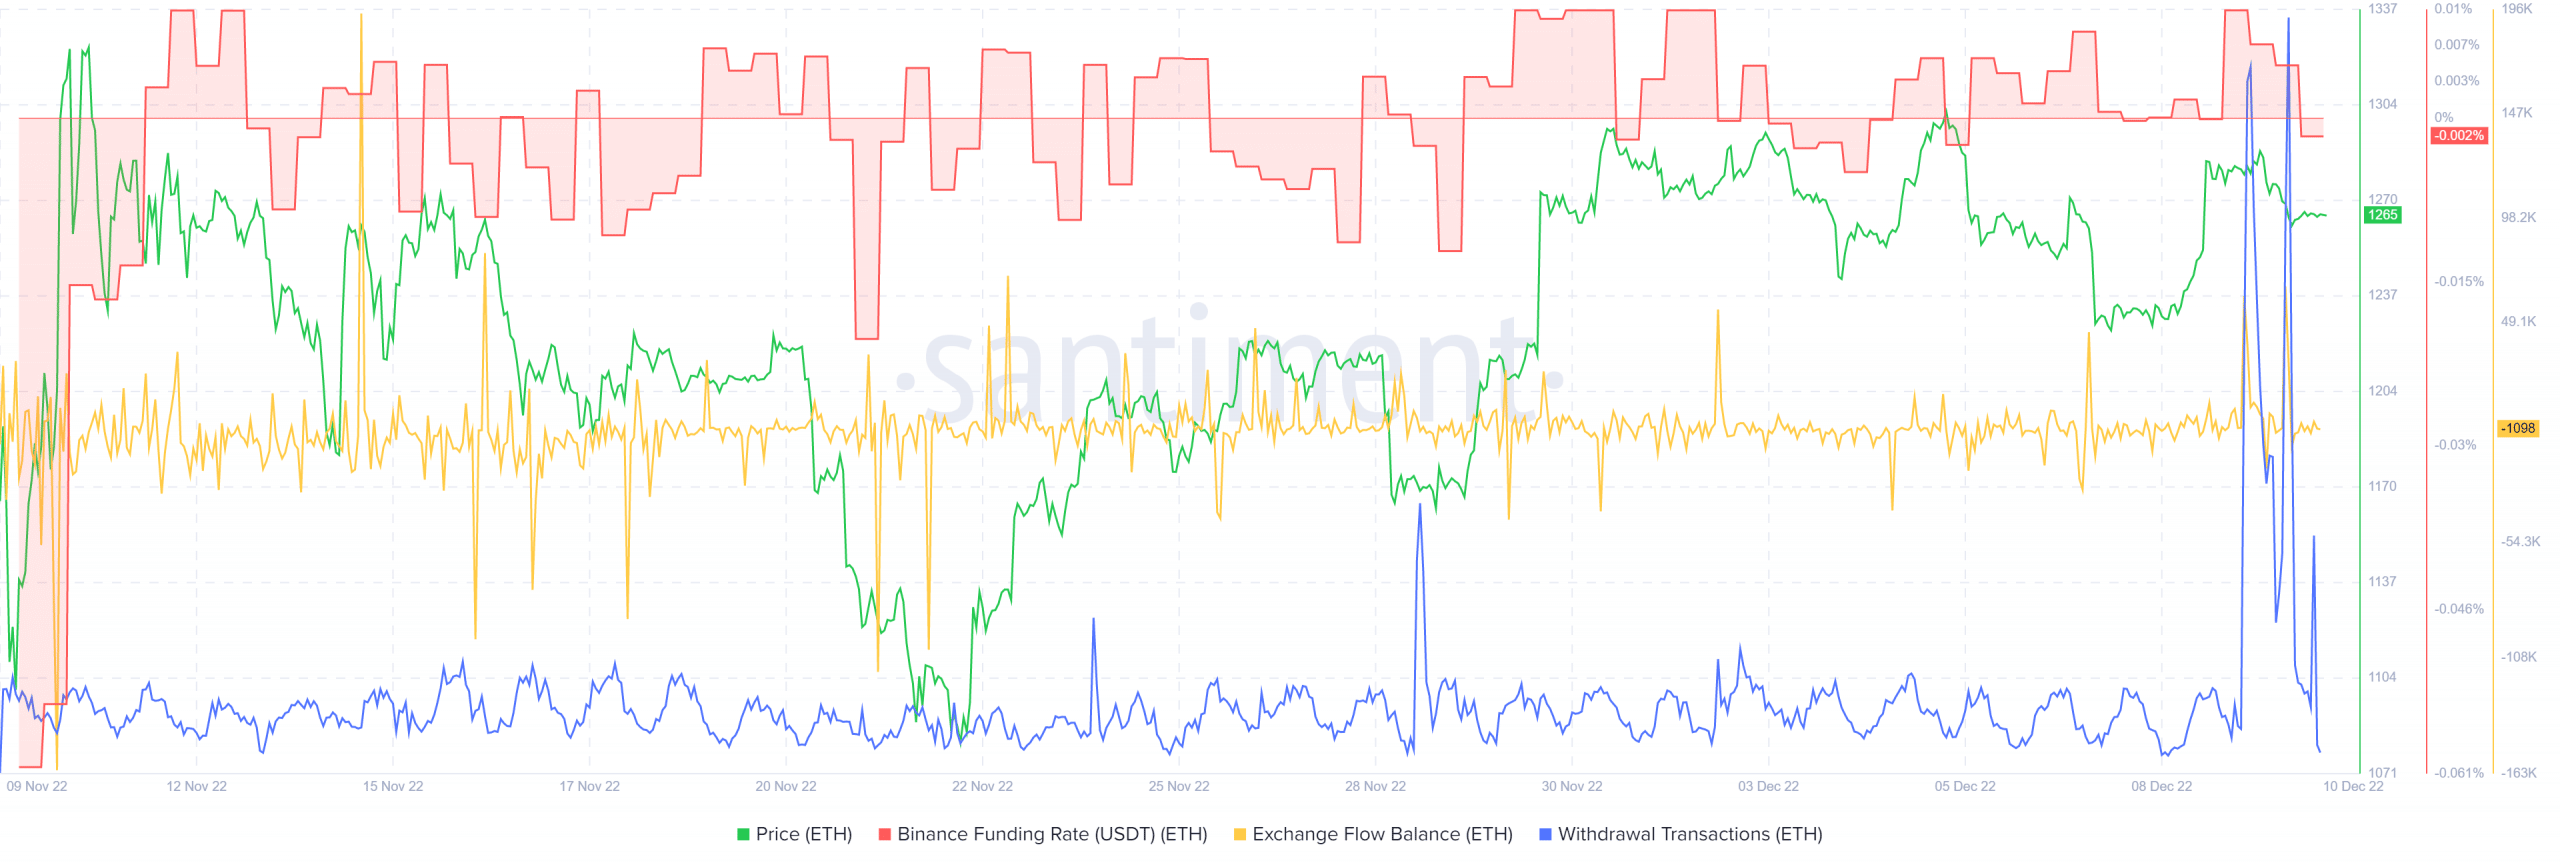
In the past few days, the funding rate was positive on Binance. This meant that futures market participants were bullishly positioned, but that took a shift in recent hours. Ethereum’s failure to break above $1300 swayed the sentiment of lower timeframe traders.
Yet, the dramatic spike in withdrawal transactions meant that investors were likely accumulating ETH. These addresses are used to withdraw the asset from centralized exchanges and could have been moved into cold storage. At the same time, the exchange flow balance did not show a large outflow, which was something that was witnessed on November 21. Back then it marked a local bottom for ETH.