Ethereum, Augur, FTX Token Price Analysis: 13 December

Ethereum showed strength in the market and recovered from the $540-level it dropped to a couple of days ago. Augur experienced significant volatility in recent weeks. Finally, FTX Token continued to climb on the charts, with the crypto on an uptrend it has been on since early November.
Ethereum [ETH]
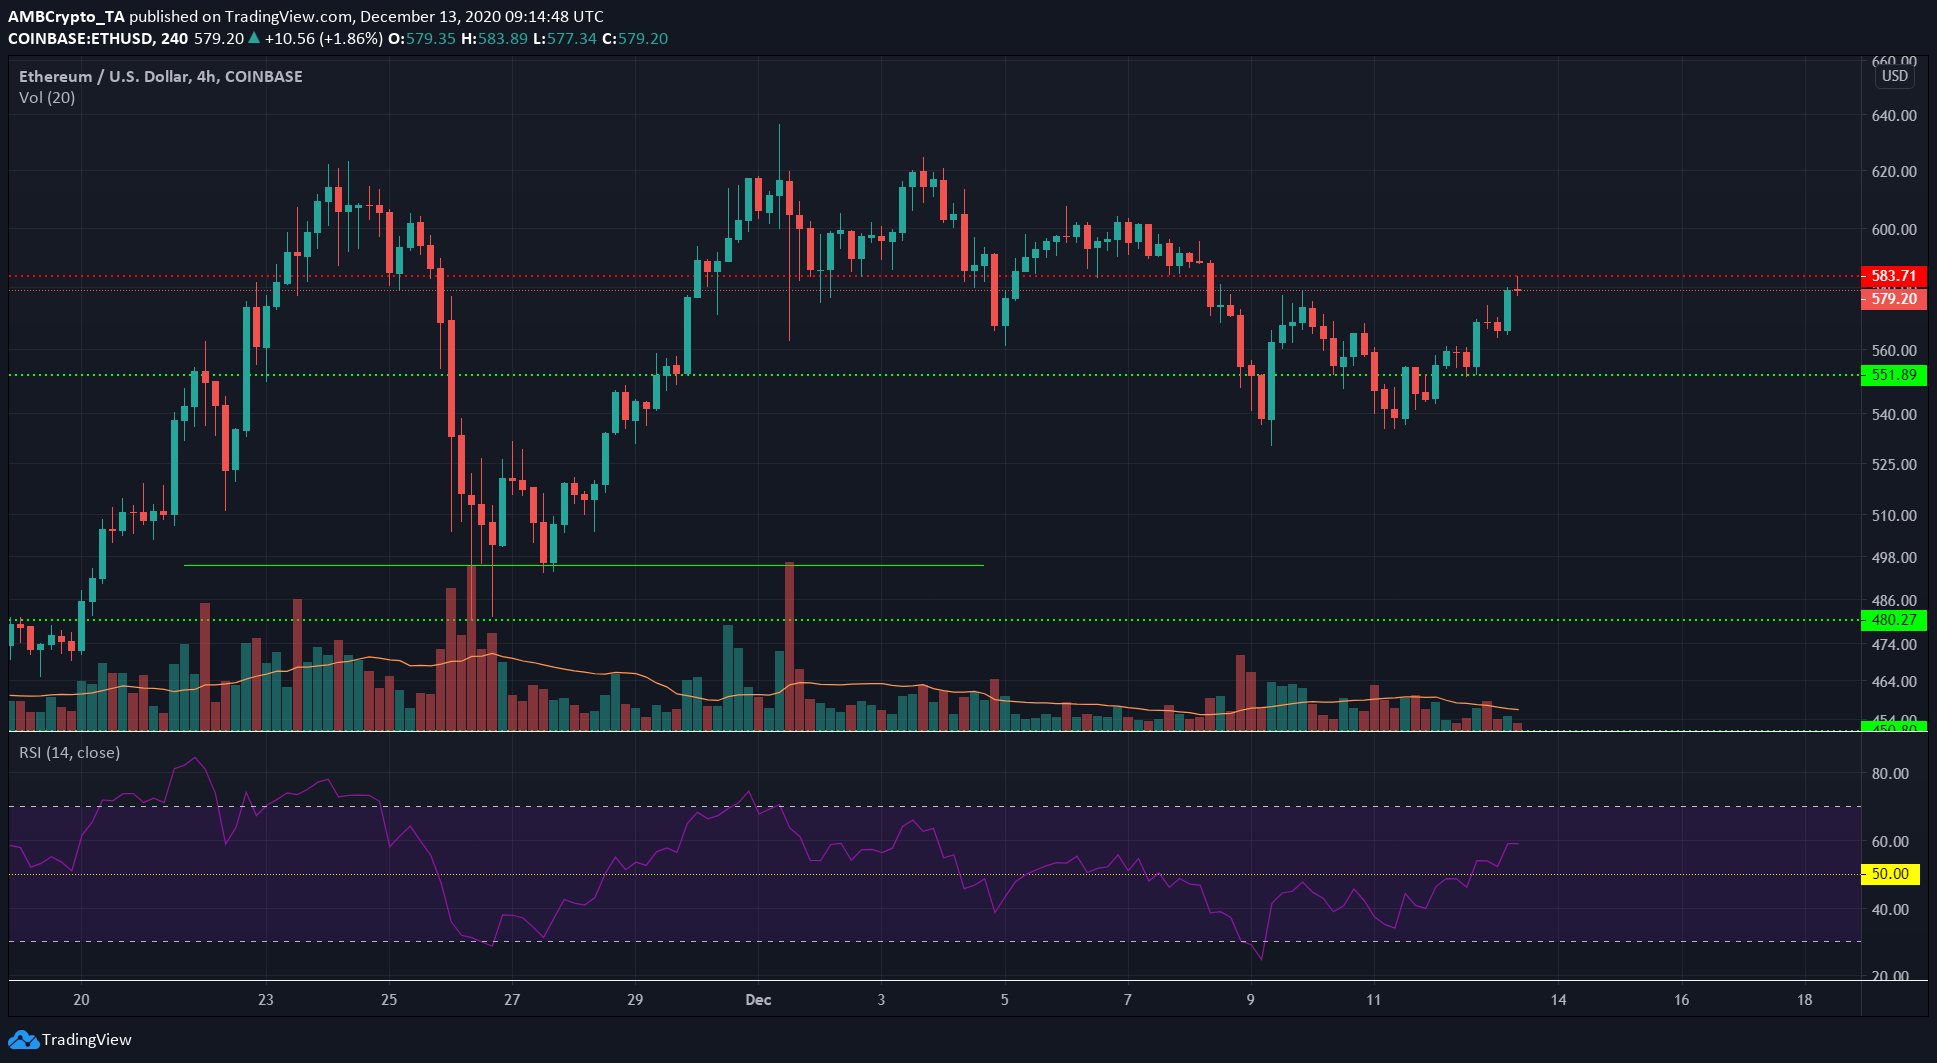
ETH slipped under the $580-mark a few days ago and slipped as low as $530, before the bulls forced a recovery. However, the price was at $580 at the time of writing and had not yet reclaimed the level of resistance as support.
The RSI rose swiftly and indicated that the downtrend was broken as it rose above 50. While the short-term outlook for the price was bullish, there was still a lack of trading volume to accompany the rise in price.
Past the $583-level, $600 and $620 can be expected to offer some resistance. However, analysis of a longer timeframe for ETH showed evidence of rising bearishness.
Augur [REP]
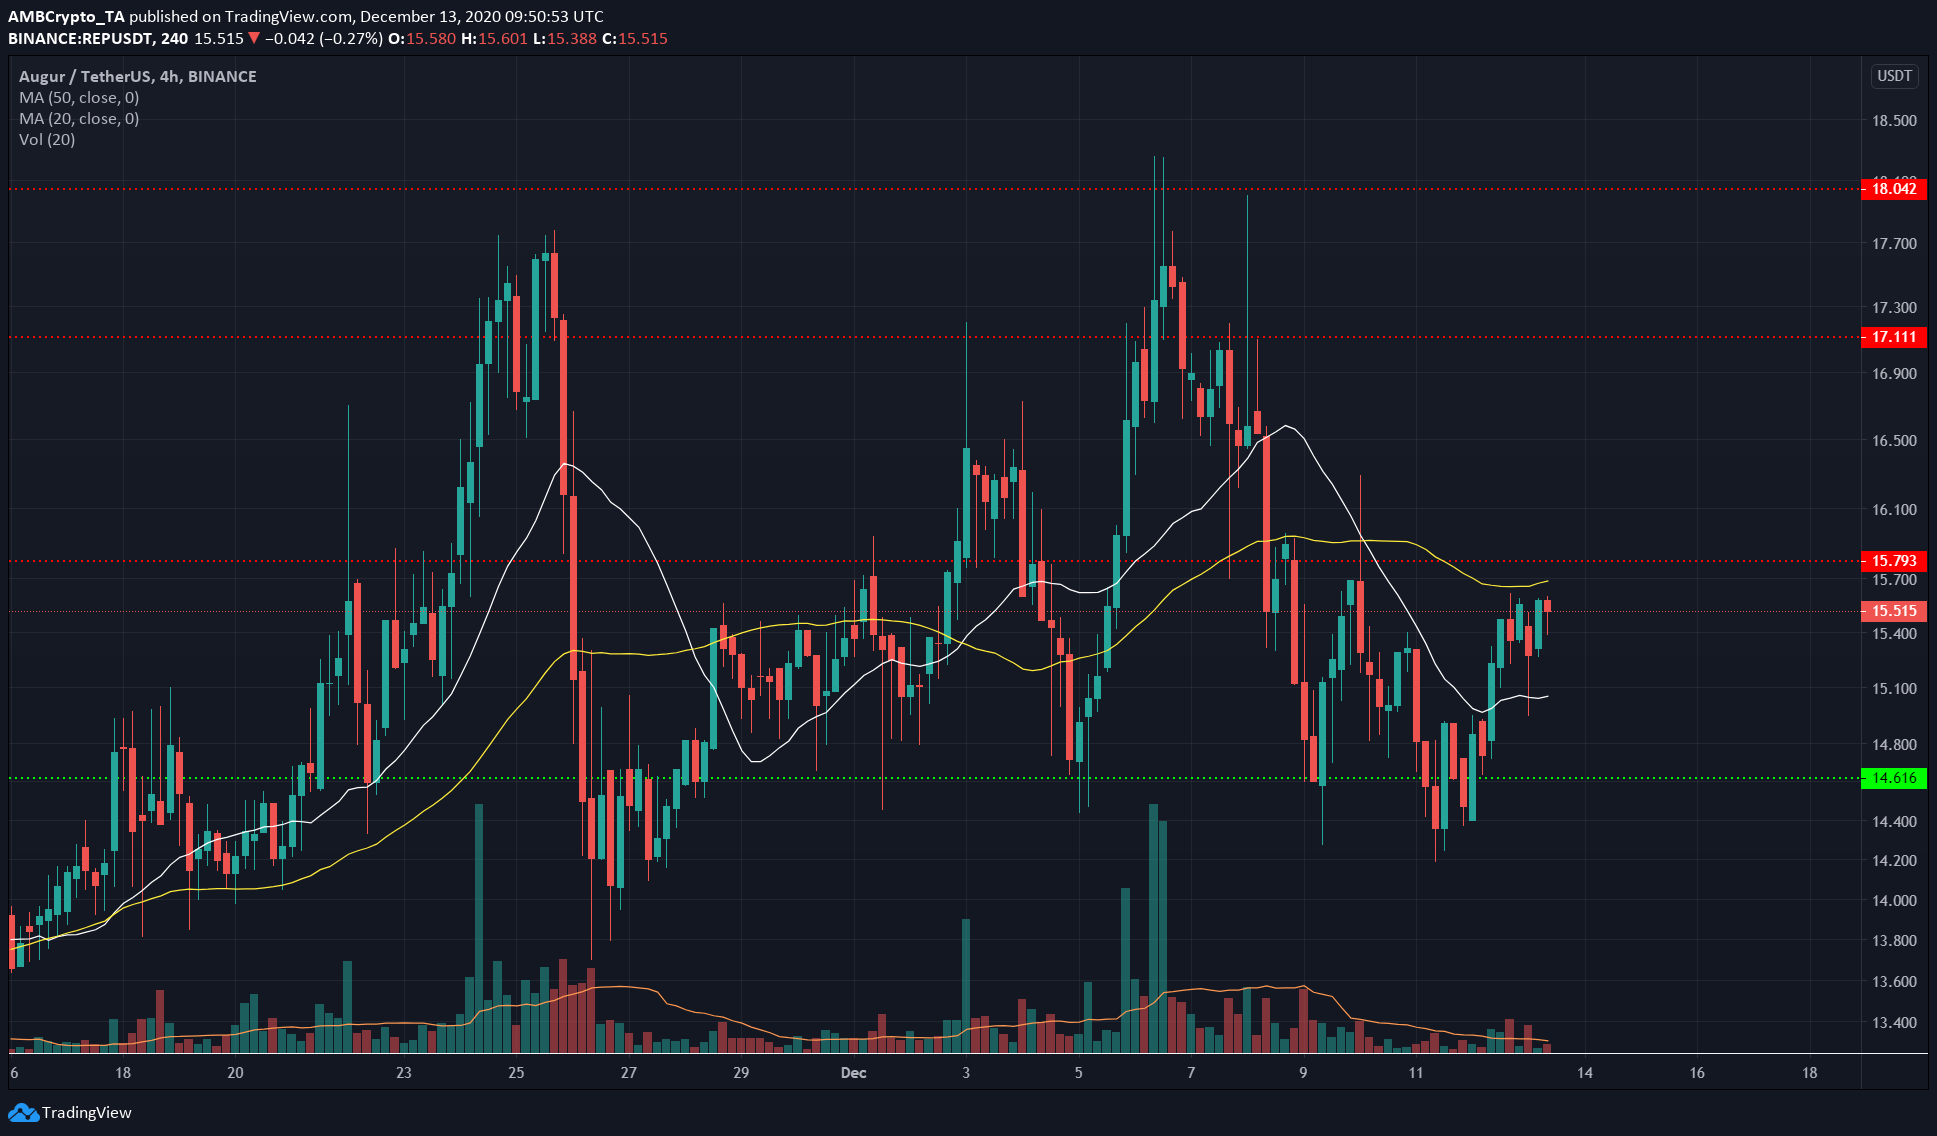
It has been a volatile period of time for Augur. In the past three weeks alone, REP saw a drop from $17.6 to $14, a subsequent recovery to touch $18 in early December, followed by a drop to $14.4 a few days ago, a level from where the price picked up to climb to $15 once more.
A trend was not present in either direction for REP from late November to the time of writing, while a strong uptrend was present for the coin from late October for a period of nearly four weeks.
The 20 SMA (white) and 50 SMA (white) can be expected to act as support and resistance for REP. The levels at $14.6 and $15.8 acted as support and resistance, respectively, and are also important levels to watch out for.
FTX Token [FTT]
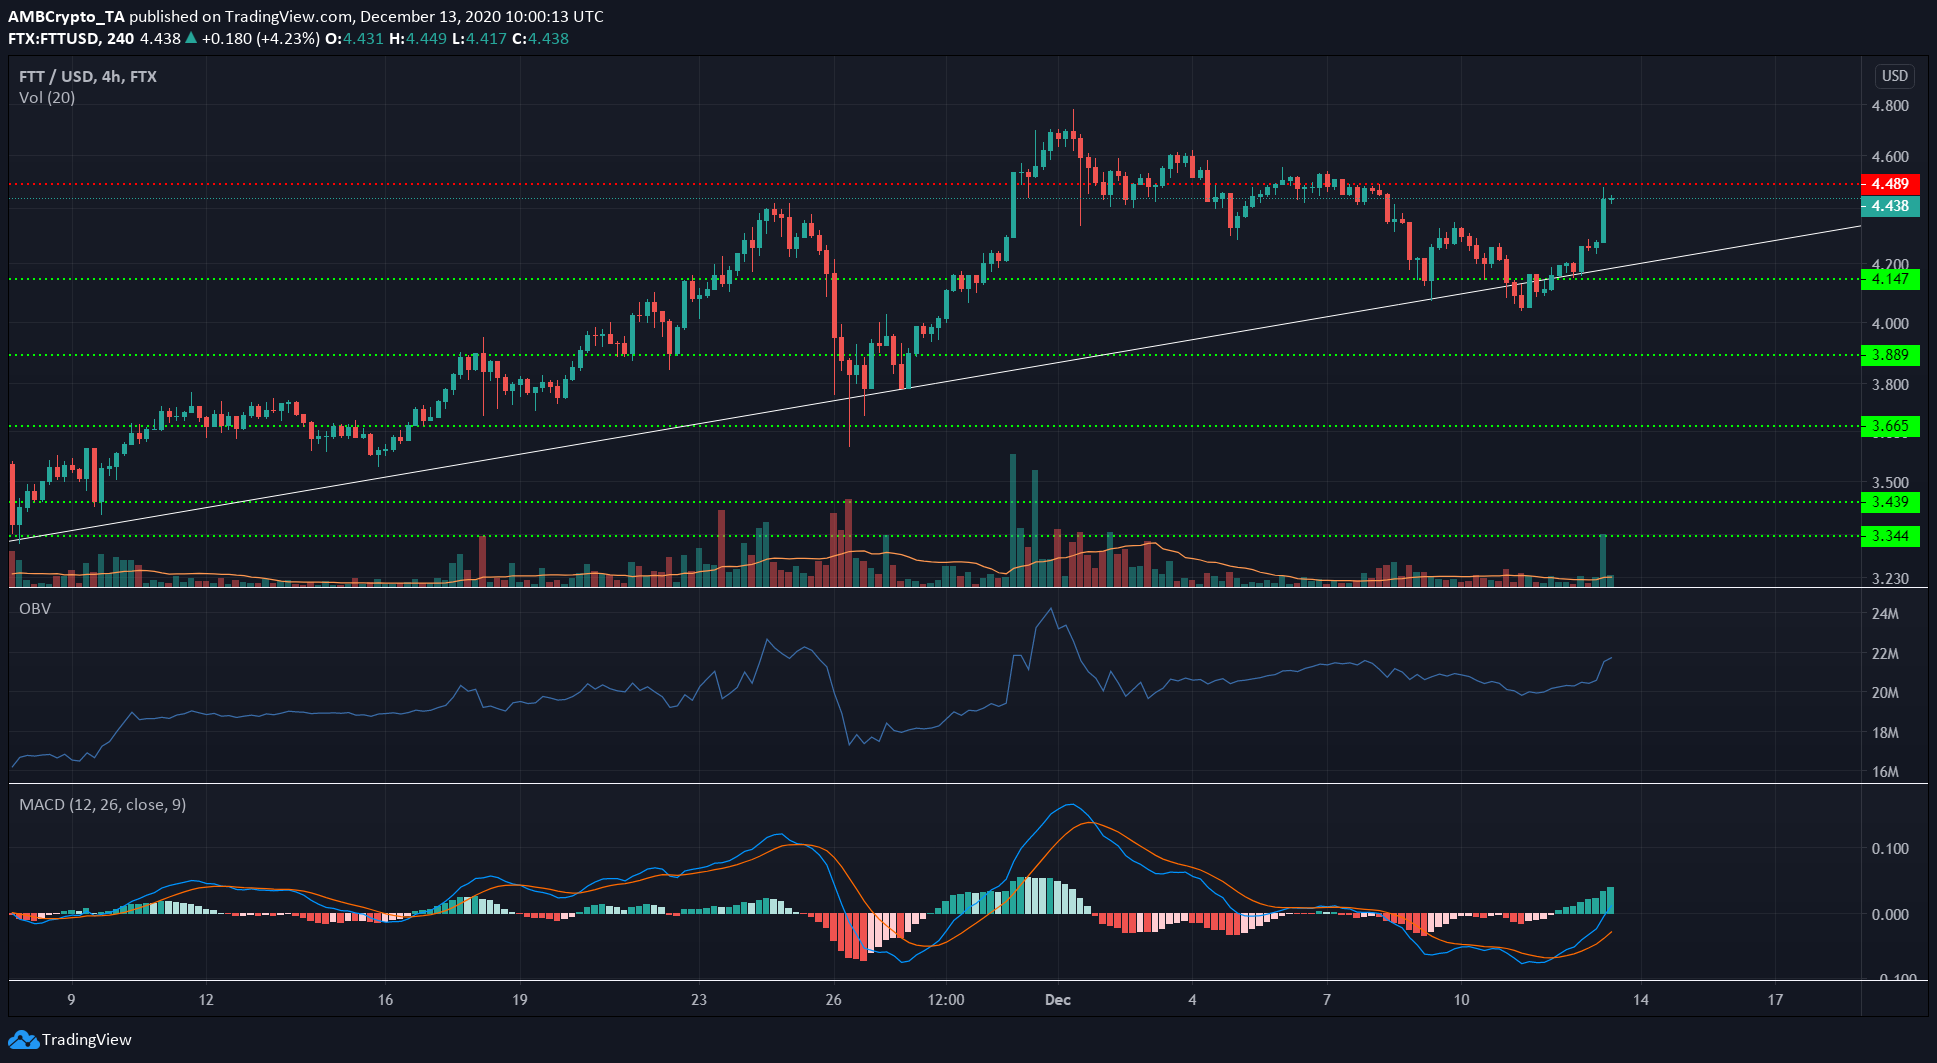
The long-term outlook for FTT was bullish. The ascending trendline has been respected by the price and it acted as support, with the recent dip under the trendline quickly bought up by the bulls.
The level of support at $4.14 was breached momentarily, but the price recovered and it climbed by nearly 7% above that level.
The MACD formed a bullish crossover and was on the verge of climbing past zero to underline strong bullish momentum behind the token. The OBV showed that there was buying volume behind the long-term uptrend and legitimized the price’s ascent.