Ethereum, Binance Coin, Chainlink Price Analysis: 01 July

A series of consistent troughs and crests have been forming in the market of late, with most cryptocurrencies yet to completely recover from the same. In fact, many altcoins have been struggling to hold on to the little recovery they registered, especially since the market was still under a bearish spell.
Ethereum was denoting an upward trend until it was hit with a bout of selling pressure. Binance Coin and Chainlink were also following this price trajectory.
Ethereum [ETH]
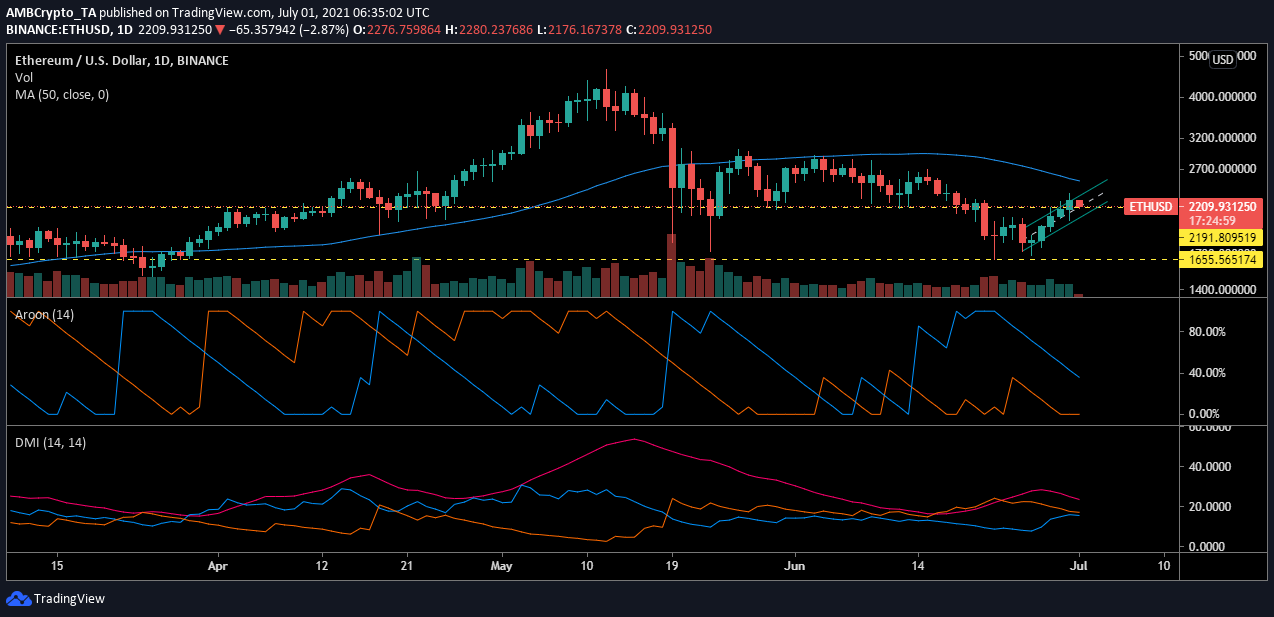
Ethereum did not trend lower than $2,191.80 for most of the month, but on 21 June, strong bearish pressure destabilized its market. The asset lost its long-standing support and dropped to the support at $1,655. This was also the first time since April that ETH’s value dropped under the $2k-mark.
As the asset collapsed to the support level, market trends became increasingly bearish. However, the subsequent recovery once again helped the price climb higher up to $2,159. While the asset tried to climb to its previous support, selling pressure kept rising. This was affirmed by the Directional Movement Index that underlined the selling pressure in the market. Although the -DI and +DI remained converged, the -DI was still dominant.
The Aroon indicator flashed bullish signs, but a reversal could be likely soon.
ETH may hover close to $2,191.80 as the market tries to achieve stability.
Binance Coin [BNB]
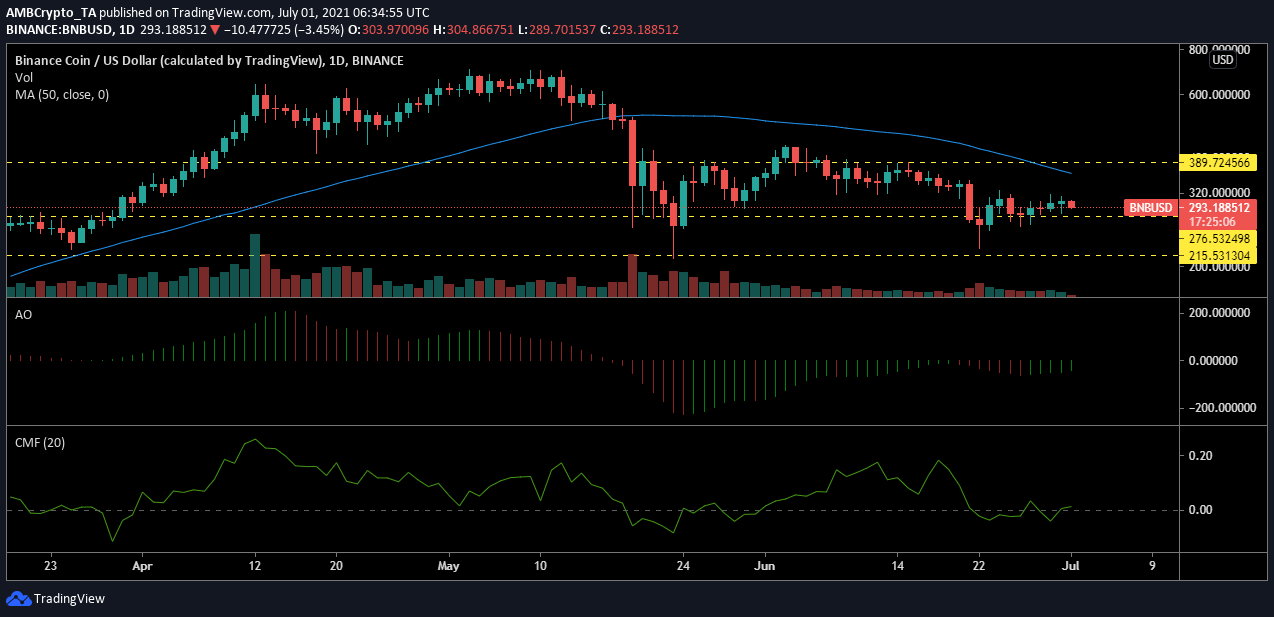
Binance Coin’s price established support at $276.53 and was trading at $293.18, at press time. The digital asset noted strong bearishness, given the high position of the 50-day Moving Average. This kept the value of the asset lower down the charts.
As BNB continued to consolidate close to the support, the asset seemed to be gaining bullish momentum, however. This was highlighted by the Awesome Oscillator that had turned green as the price continued to trade between $276 and $309. This could be the prevailing trading range for the asset and BNB may remain within this range in the near term.
Money was starting to flow into the BNB market, according to the Chaikin Money Flow, a sign that traders were increasingly trading at this range.
Chainlink [LNK]
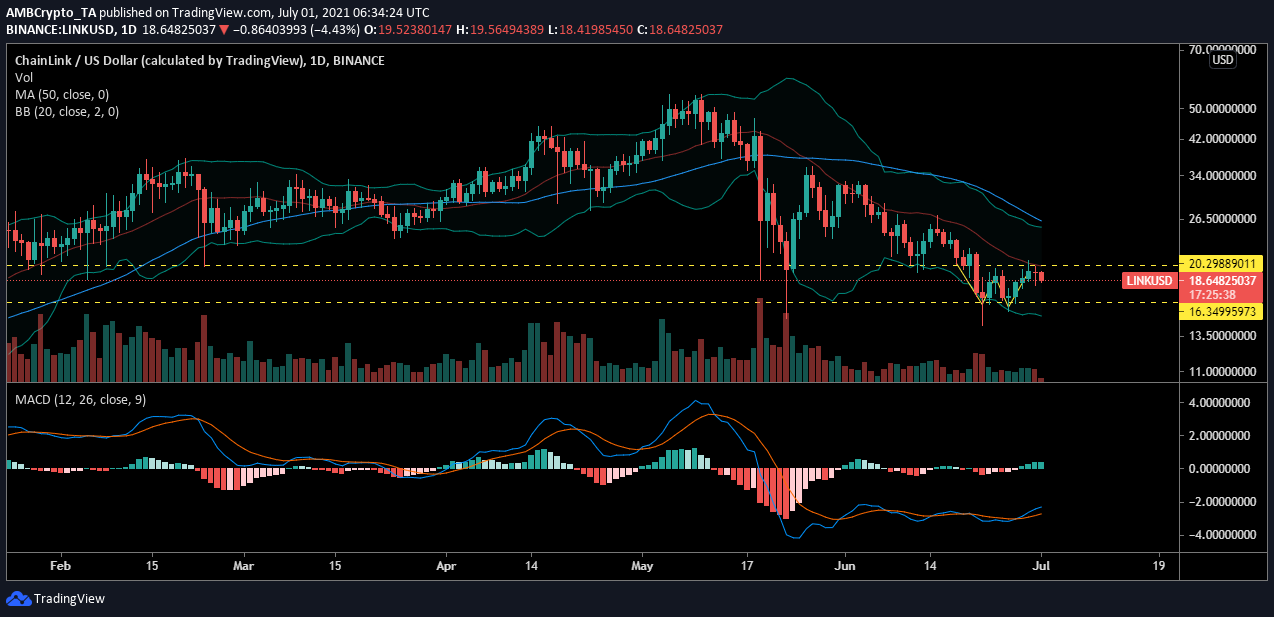
Chainlink’s price was awaiting a breakout as the asset seemed to be forming a W, that is a double bottom. This double bottom could lead LINK’s price to surge to the immediate resistance at $24.52. However, at press time, LINK was on a downtrend and was valued at $18.64.
This downtrend sparked volatility, causing the Bollinger Bands to diverge. This made the market more susceptible to price swings. The MACD indicator, on the other hand, pointed to a bullish awakening in the market. This could be due to traders trying to keep the LINK market afloat.


