Ethereum, Bitcoin SV, Compound Price Analysis: 12 April

Ethereum was predicted to touch $2,200 or higher before a minor pullback took place. Bitcoin SV could break lower from its ascending channel over the coming days, while Compound could go as low as $337 in case of a breakdown from a descending triangle.
Ethereum [ETH]
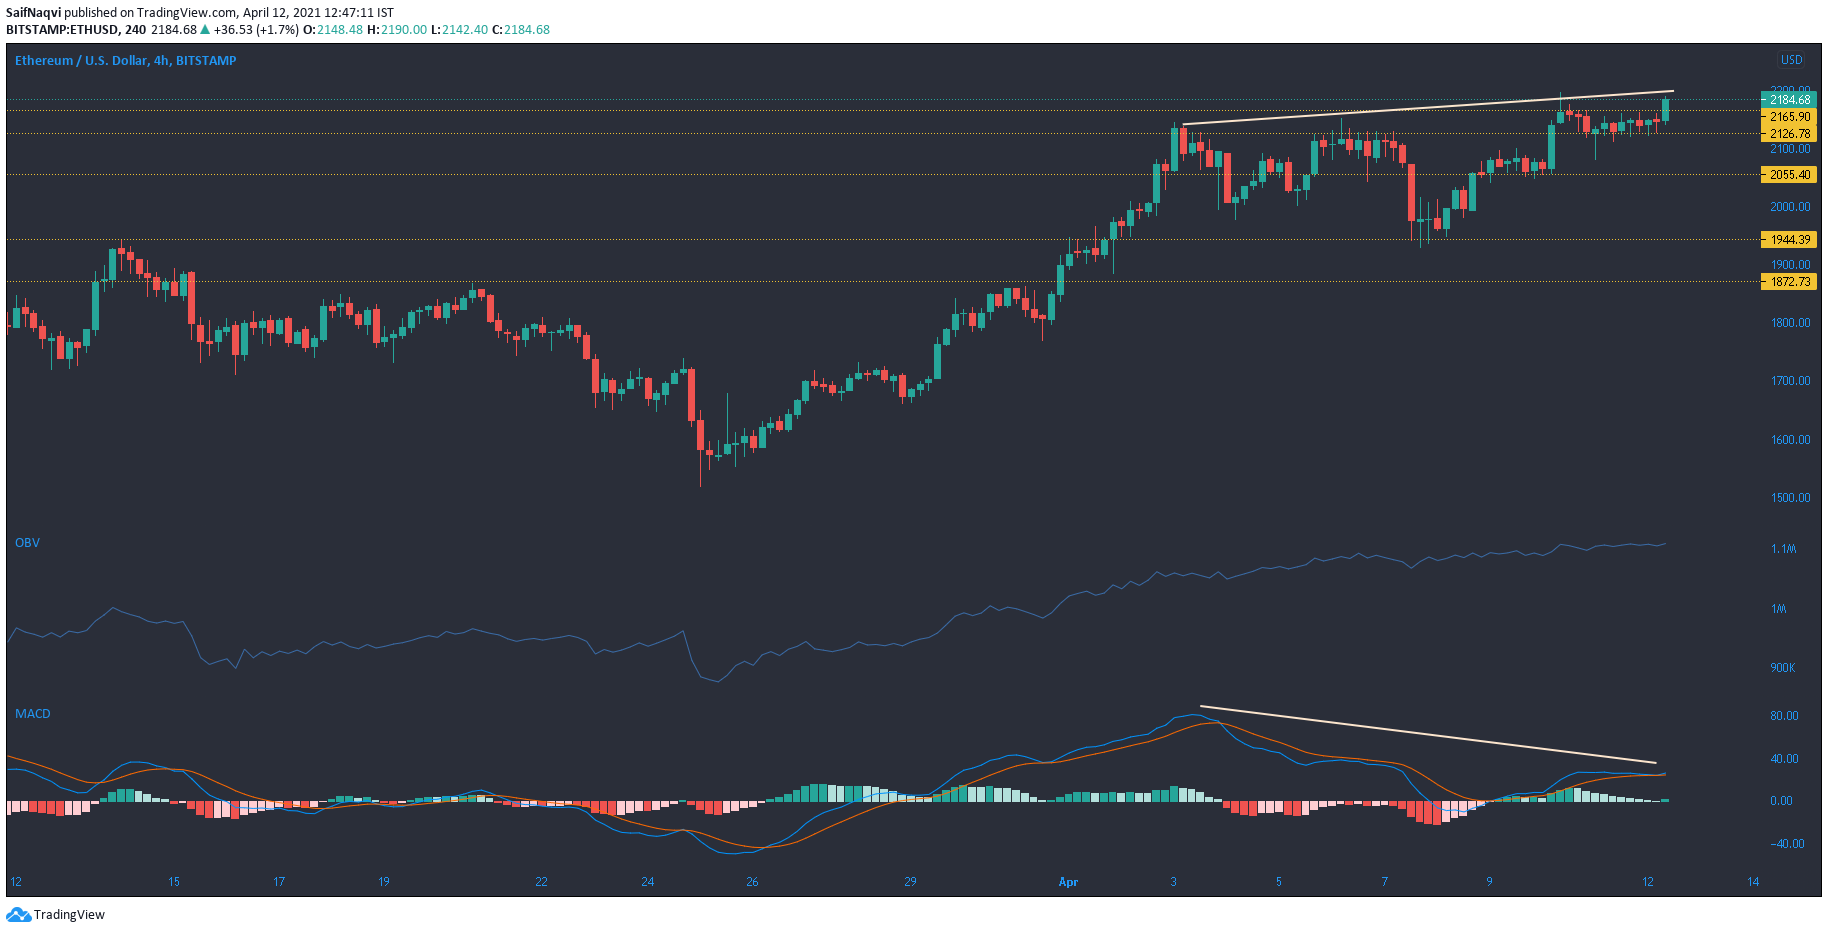
While the king coin keeps facing stiff resistance above $60k, Ethereum has been making new price discoveries over the last couple of days. ETH’s weekly, monthly, and year-to-date gains have outperformed Bitcoin and underline its bullish cycle in 2021 so far. On the 4-hour timeframe, the price maintained its upwards trajectory and broke above a resistance level at $2,165.9.
The OBV has consistently moved higher since late February as buying pressure remains a dominant force in the market. However, the MACD did note a bearish divergence and this raised some eyebrows moving forward. Even the 24-hour trading volumes slipped by 10% and moved below $20 Billion. The price could snap $2,200 and even move above this mark today, but there was a chance of slight dips as well. Support at $2,126.7 and $2,055 were levels of importance in case of a pullback.
Bitcoin SV [BSV]
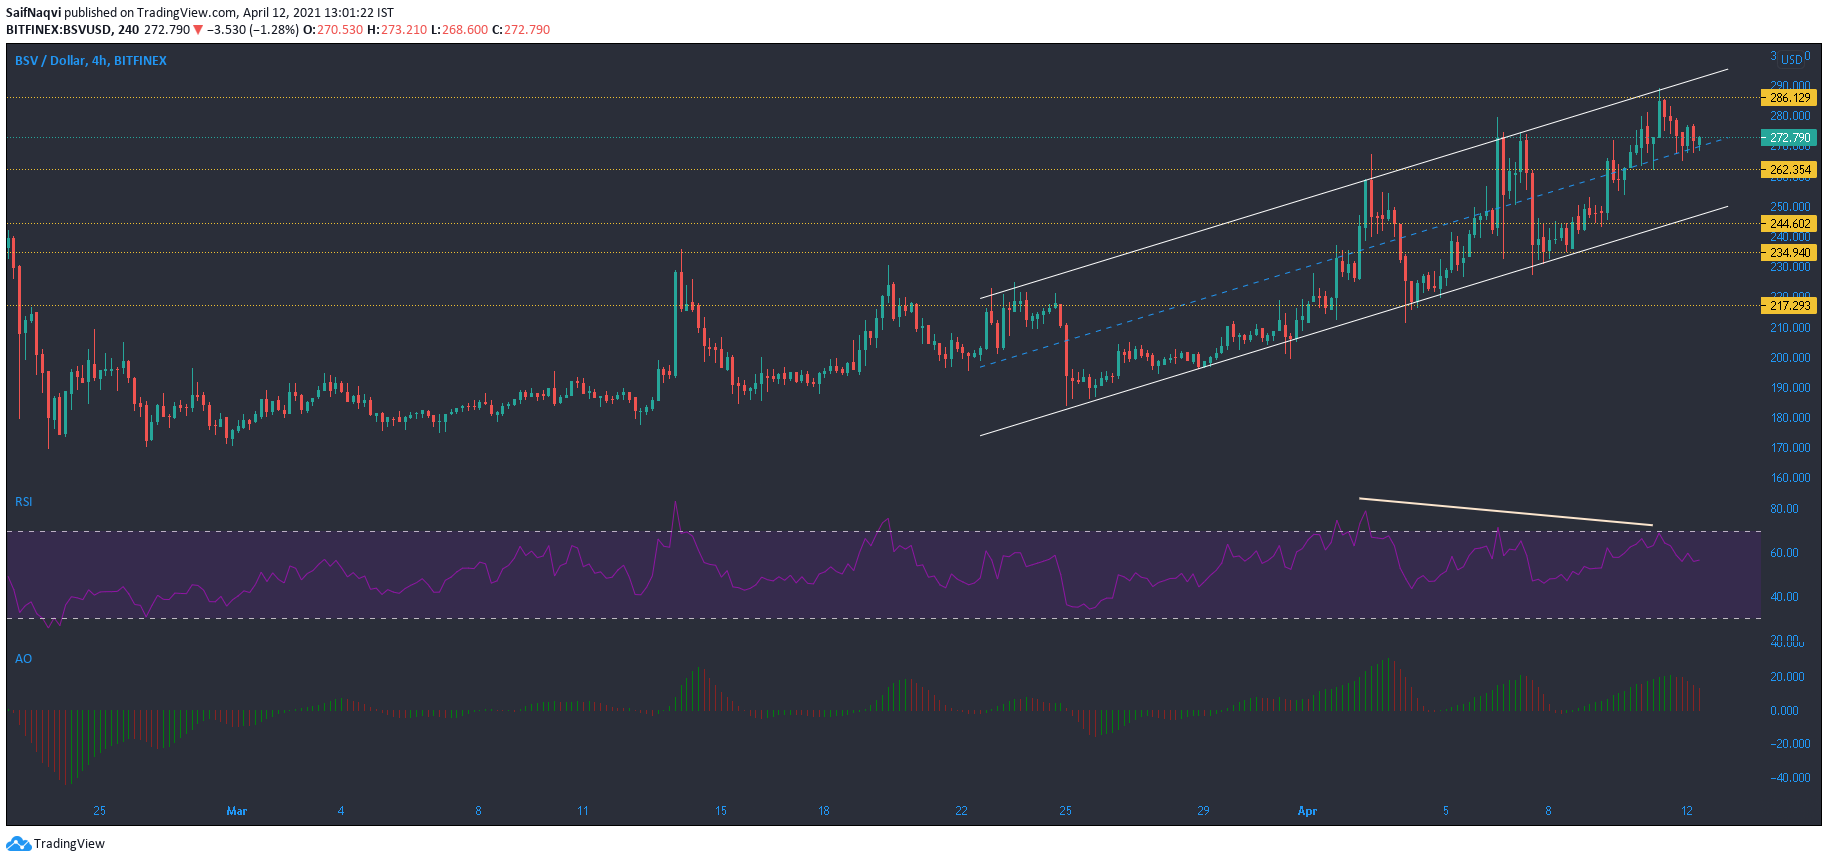
Bitcoin SV moved south after failing to flip $286.1 resistance but its movement was still within an ascending channel. While the price did hover above the equilibrium mark of its channel, the next sessions must be monitored closely in terms of a breakdown. The RSI showed a bearish divergence after it formed lower highs on the chart. If the index dips below 40 over the coming sessions, the threat of a breakdown would be heightened.
The Awesome Oscillator made three peaks above the half-line but these were followed by some bearish momentum. Trading volumes were already trending lower over the past few days. A move below from this pattern could test support levels at $244.6 or $234.9.
Compound [COMP]
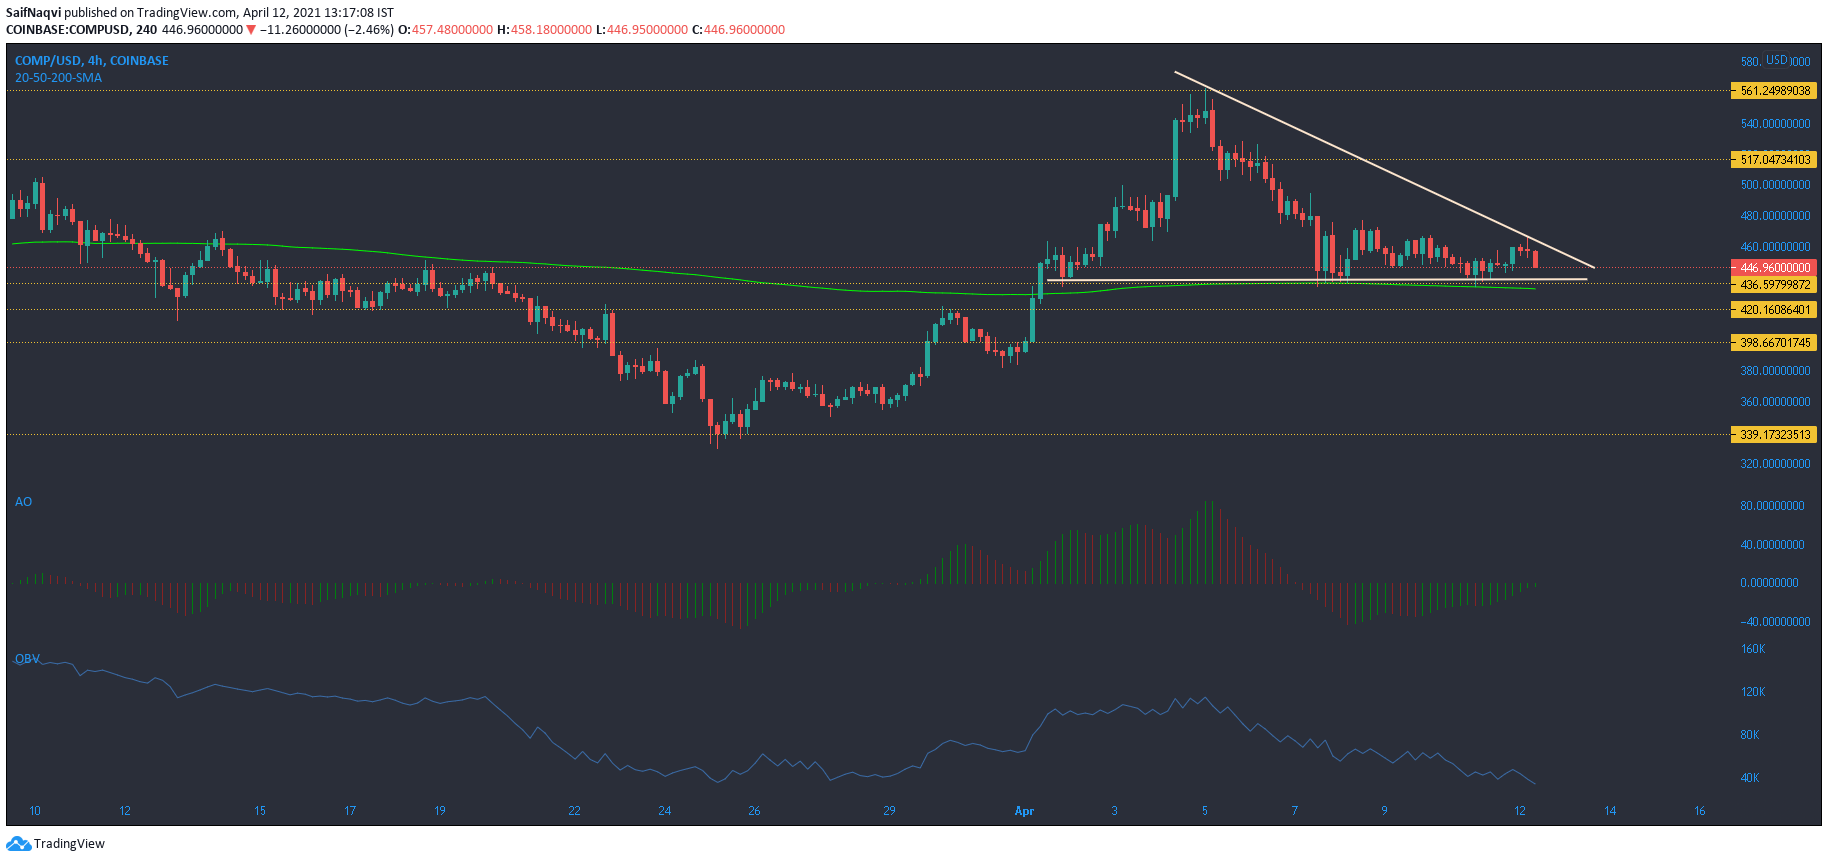
On the 4-hour chart, Compound highlighted another descending triangle after the price moved south from the $561.2 resistance. The bottom trendline of the pattern coincided with the 200-SMA (green) and it wasn’t clear when a breakdown would take place.
The Awesome Oscillator showed that momentum was actually on the bullish side and a move above the half-line would likely see a breakout in the opposite direction for COMP. On the other hand, the OBV underlined the current selling pressure in the market. If a breakdown does take place, support areas lay at $420.1 and $398.6 but a move below this was also possible. A fall back to $337 could offer buy signals to long-term traders.