Here’s what’s next after the latest near-term range lows for ATOM

Disclaimer: The findings of the following analysis are the sole opinions of the writer and should not be considered investment advice
Cosmos’ native token ATOM has been on a downtrend over the past week. Earlier in January, the price managed to hold on to crucial support levels at $34 and $30, despite the strong selling pressure on Bitcoin and across the rest of the market.
However, the fearful sentiment in the crypto-sphere has caught up with Cosmos over the past couple of weeks. At the time of writing, ATOM was laboring beneath the $29.94 resistance level, while a trendline resistance from mid-January also remained unbroken.
ATOM- 1 hour chart
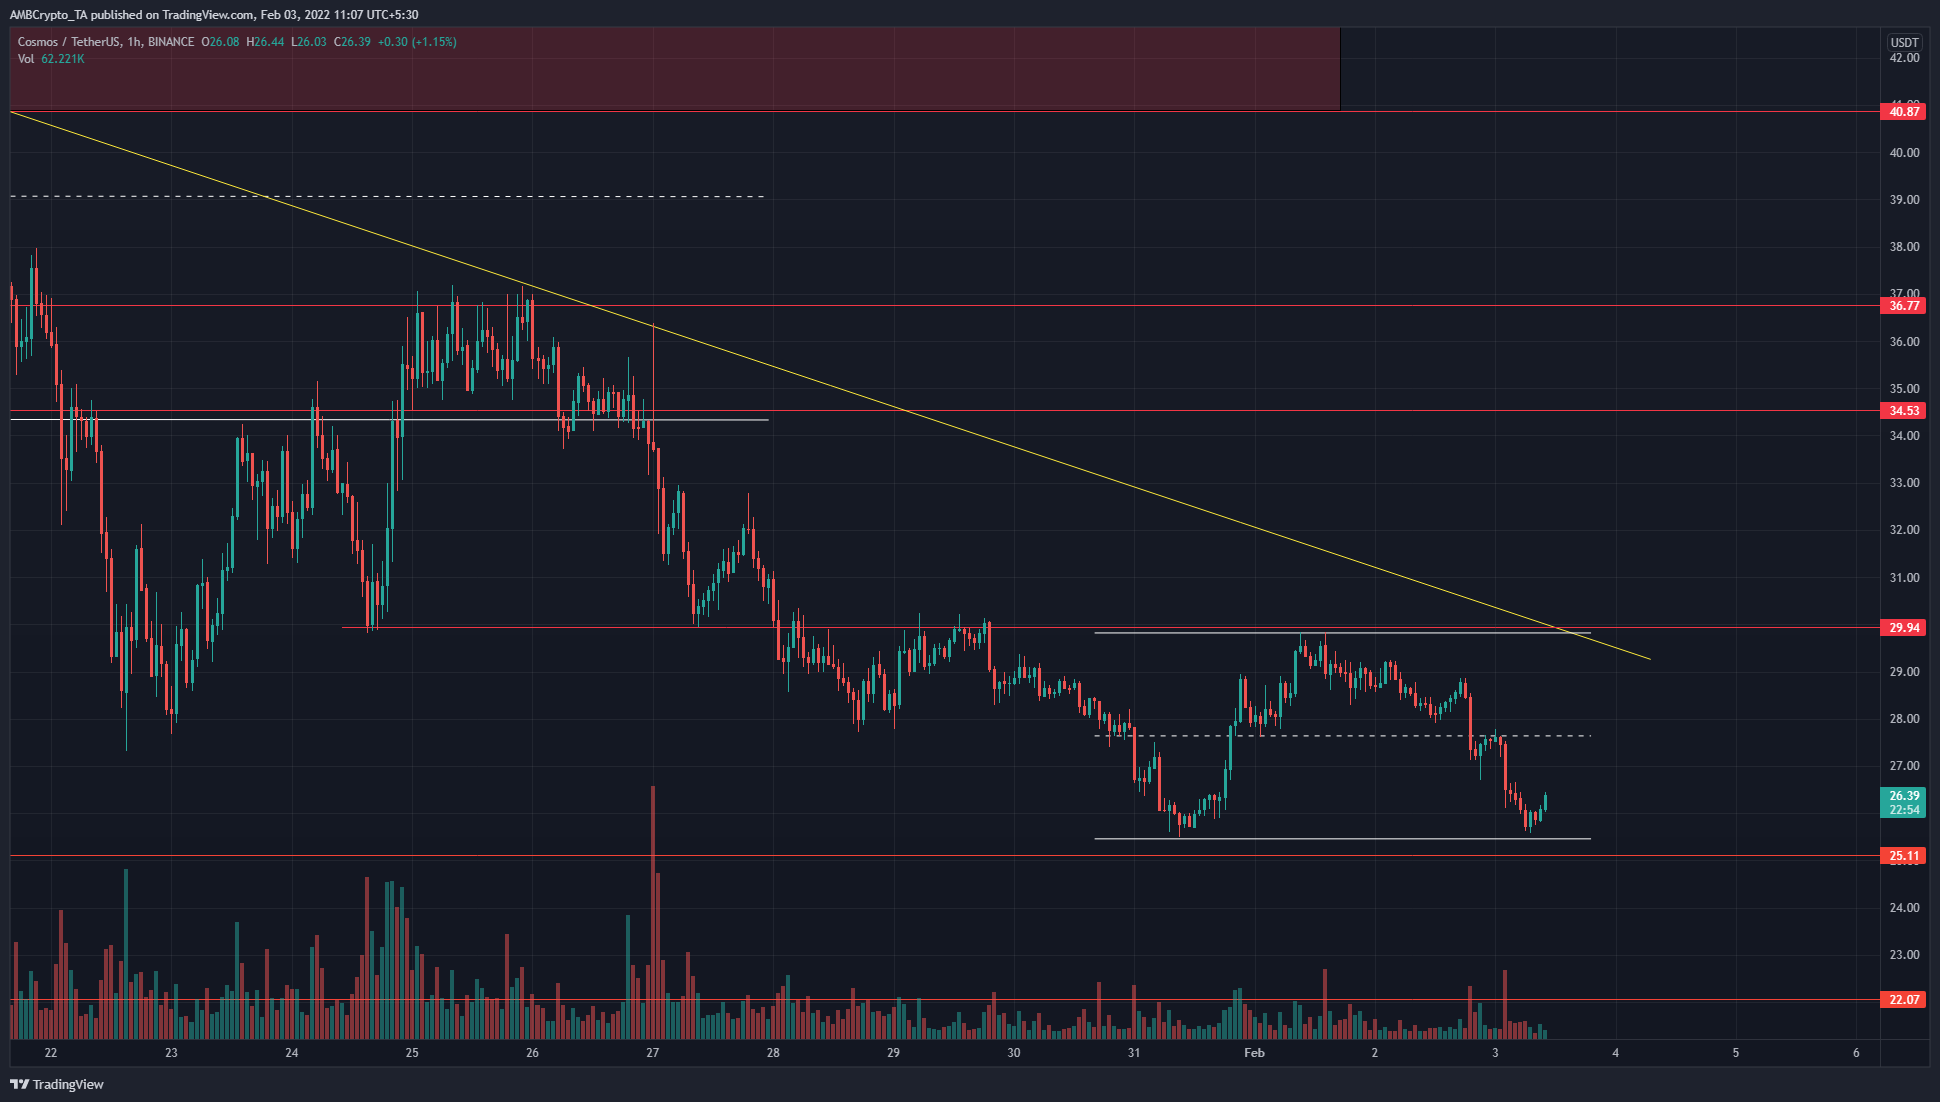
At the time of writing, the price had found some demand just above the previous lower low at $25.48. This indicated that, at least in the short-term, ATOM could be trading within a range (white). The range lows and highs lay at $25.48 and $29.94, which marked near-term support and resistance levels. The mid-point of the range at $27.6 can also be expected to act as resistance to the price movement.
Unless ATOM can break above the $29.94 -level and retest it as support, the bias for ATOM’s market would have to be bearish. That does not rule out the possibility of a bounce for ATOM from where it was trading at press time, back towards $27.6 and $29.94. These levels would have to be viewed as selling opportunities.
Rationale
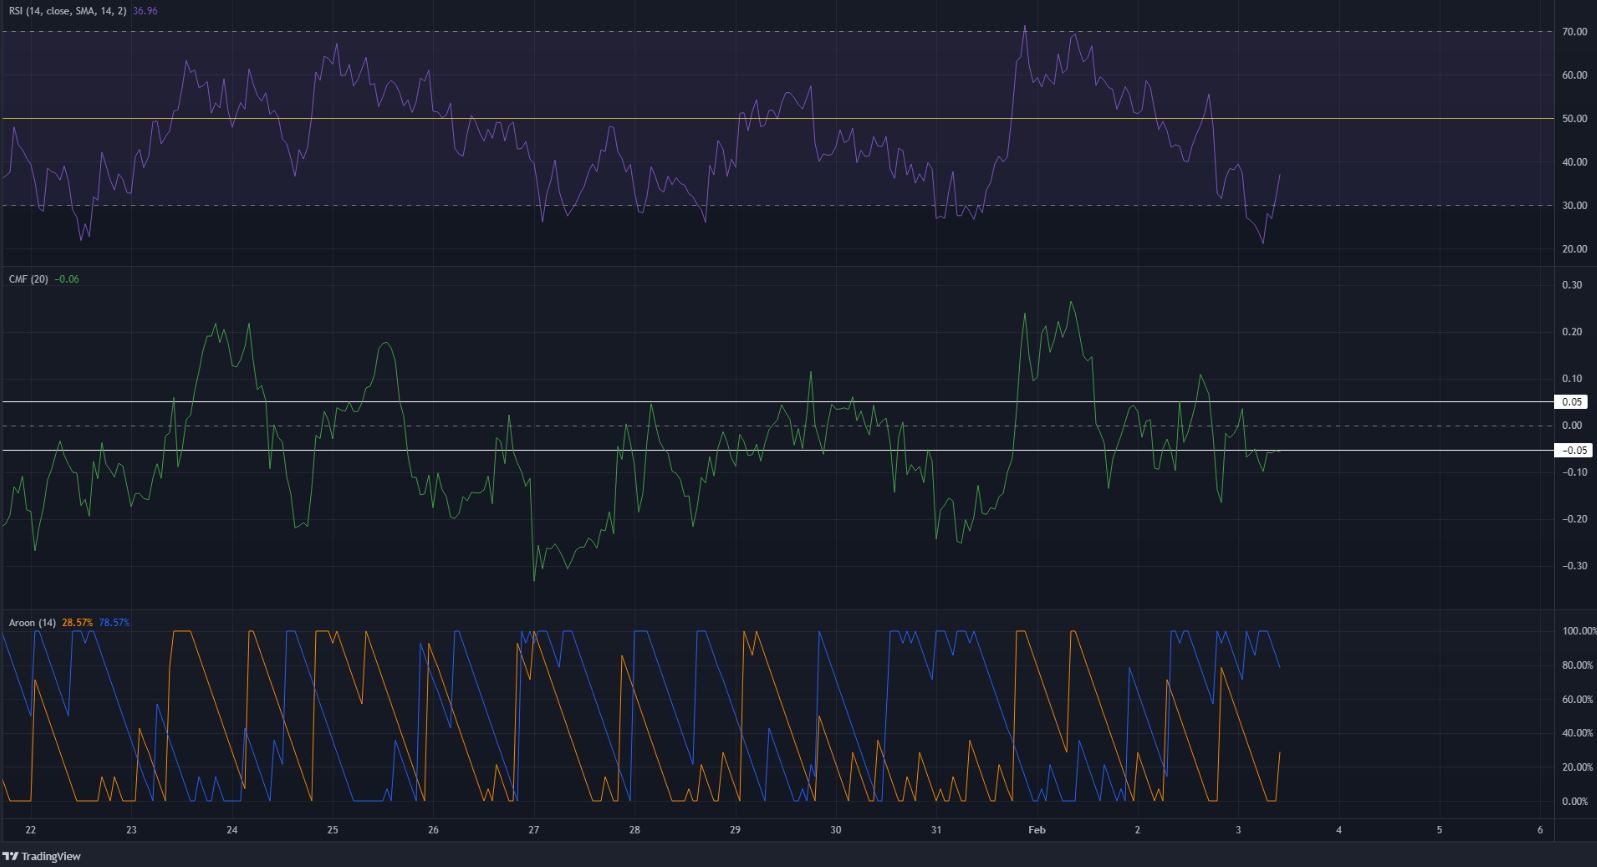
The indicators also showed that the past few days were likely just ranging price action for ATOM. Neither the buyers nor the sellers appear to have the upper hand in the short term, although bearish sentiment has been strong in the past couple of weeks. This tipped the bears to win the skirmishes at crucial junctions such as $30 and $27.6.
The hourly RSI has climbed from oversold to overbought and back to oversold in the past few days as ATOM oscillated within the range. This showed that a trend was not present. The Chaikin Money Flow indicator also showed that bulls and bears have taken turns being in the driving seat over the past few days.
The Aroon indicator also highlighted the lack of an overall trend over the past week, although it leaned more towards the bearish side.
Conclusion
The market structure will remain bearish unless the $29.94 highs can be flipped to support. A bounce in price towards this level is possible, although Bitcoin had recently been rejected at the $38k resistance area and could drop further.
The next levels of significance for ATOM to the south lay at $23.5 and $22.07.


