Solana, Dogecoin, EOS Price Analysis: 20 January

As the weekly losses wiped billions off the market cap, the near-term technical indications of Solana, Dogecoin and EOS continued to skew towards the bears.
While Dogecoin and EOS saw descending channels, their indicators still kept the bullish hopes alive.
Solana (SOL)
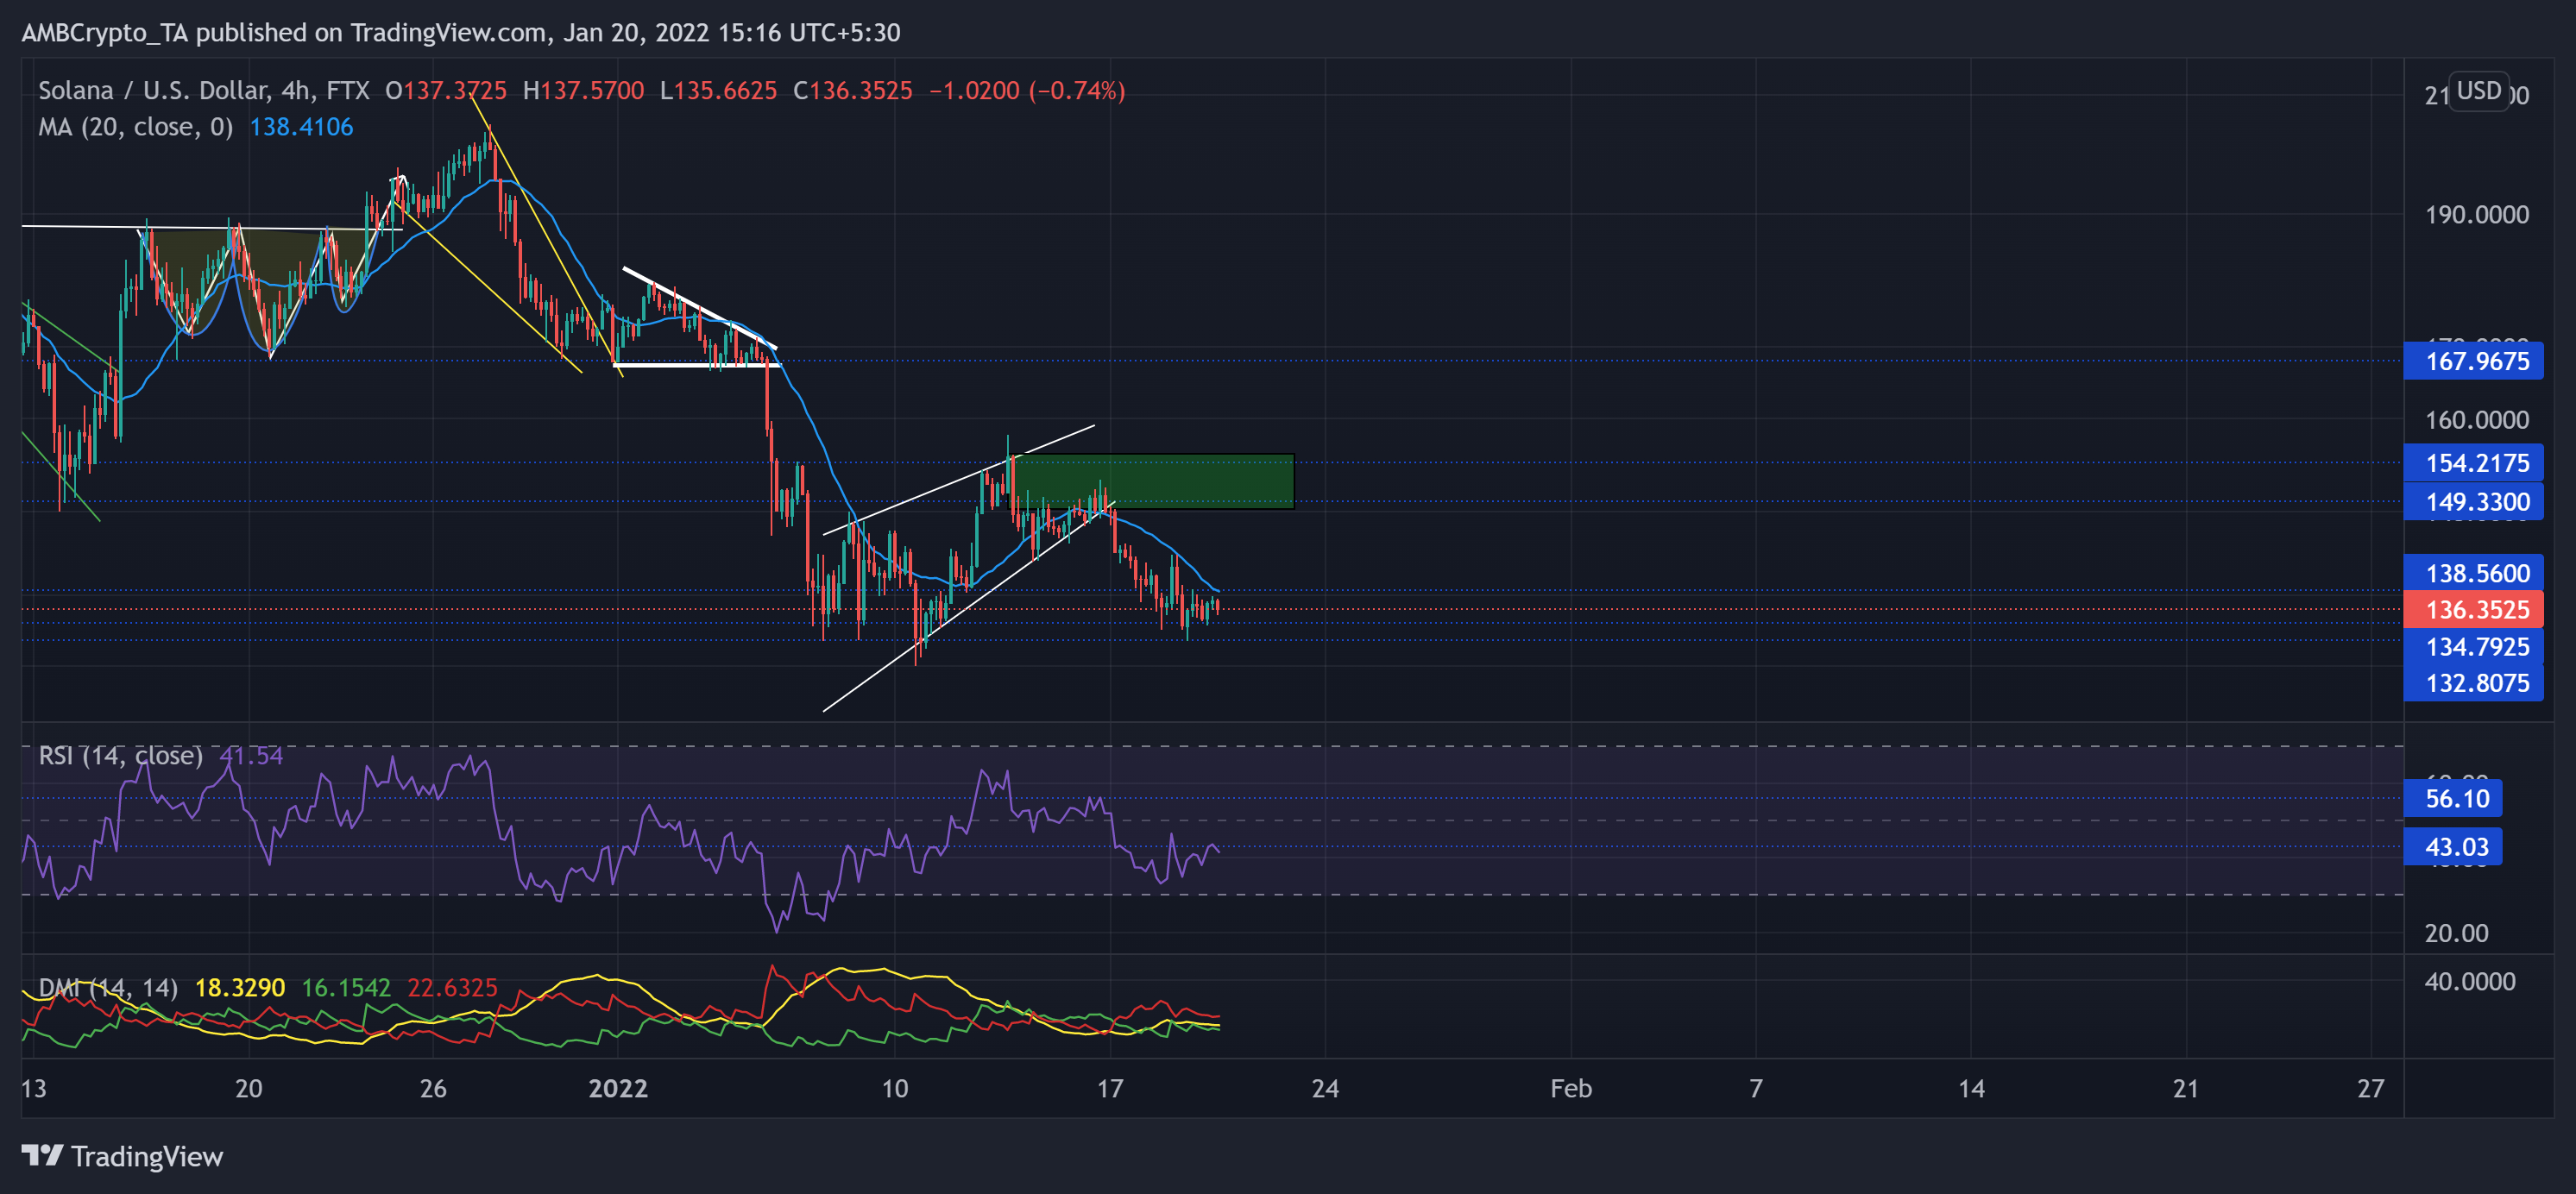
The 5 January sell-off triggered a descending triangle (white) breakout of the alt’s 4-hour chart. After an over 20% retracement until its 15-week low on 10 January, SOL formed a rising wedge that saw a reversal from the immediate supply zone (rectangle, green).
Since breaking down from the wedge, the 20 SMA (cyan) stood as a strong immediate resistance for the bulls.
At press time, the alt traded at $136.2525. While the buyer failed to uphold the vital 43-mark RSI, it dipped toward the 33-level. Over the past few days, the RSI struggled to counter the 43-point resistance. Moreover, the +DI (red) and the -DI (green) displayed a selling bias and did not flash any converging signals in the near term. Nevertheless, the ADX depicted a weak directional trend for SOL.
Dogecoin (DOGE)
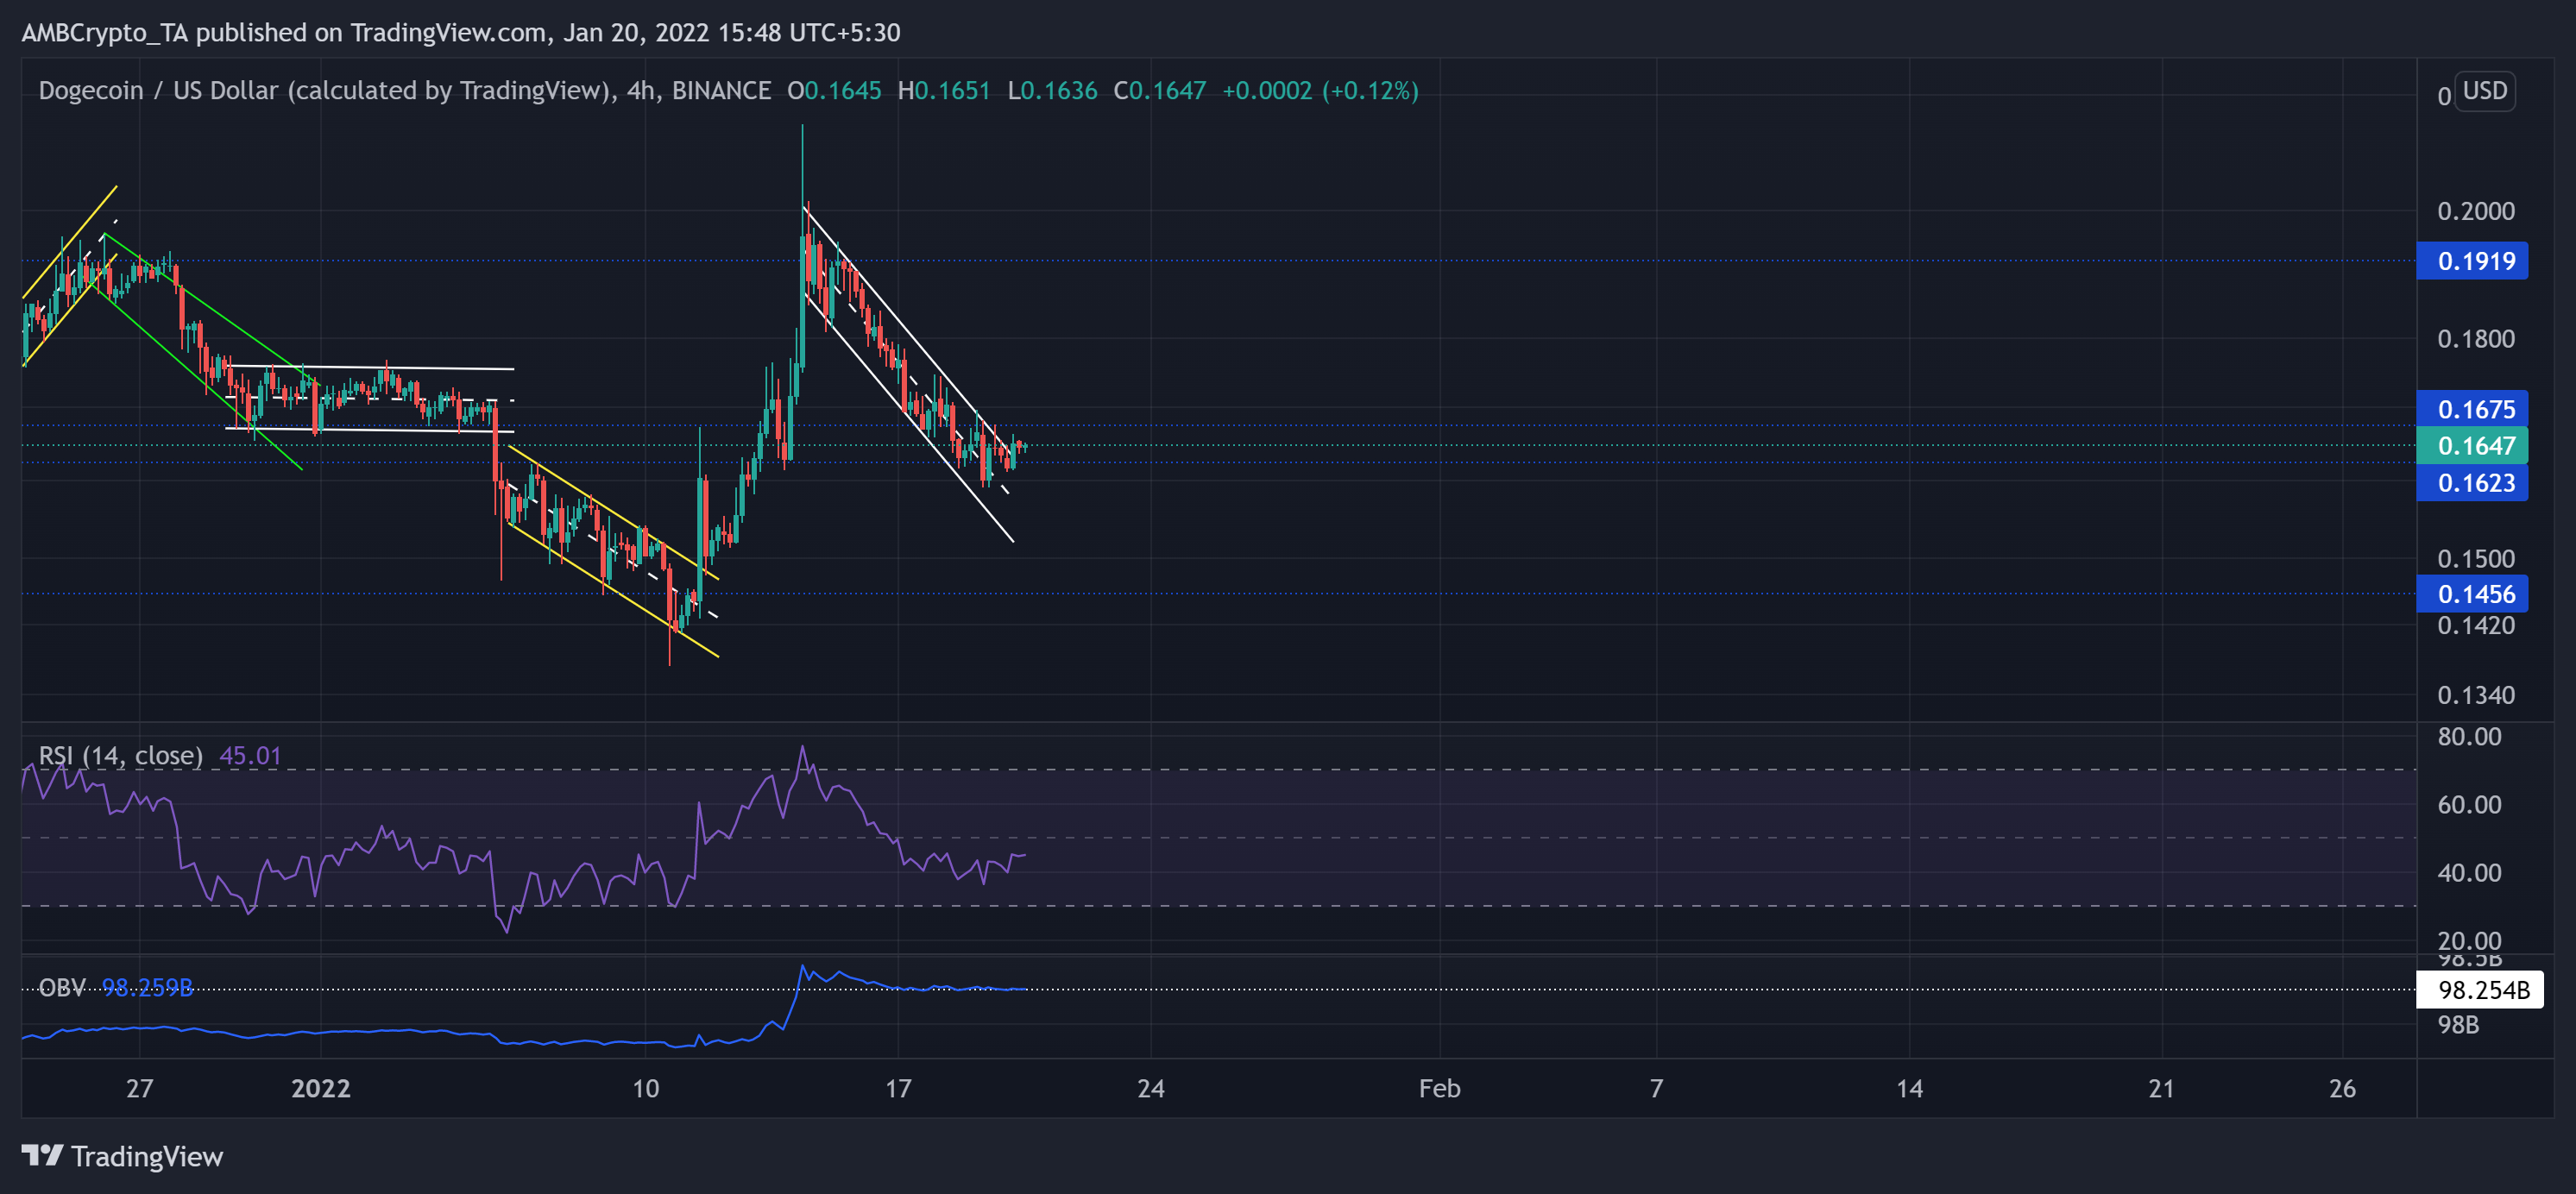
After poking its five-week low on 10 January, DOGE saw a staggering 55.94% ROI until it touched its month-long high on 14 January.
However, the bears ensured the $0.1919-mark resistance as the price retreated by over 23.4% in the last six days. It formed a down-channel (white) on its 4-hour chart. Now, as the bulls seemed to defend the $0.1623-level, the immediate resistance stood at the $0.1675-mark.
At press time, DOGE traded at $0.1647. An over 30 point plunge since 14 January has led the RSI to sway below the half-line. Now, it moved sideways while flashing a bearish edge. Interestingly, DOGE’s OBV continued to maintain the level and did not correspond with the substantial dip. This reading hinted at a possible bullish comeback.
EOS

With a 19.9% retracement (from 5 January), EOS poked its five-week low on 10 January. Since then, EOS marked an over 14.7% recovery after breaking out of the previous descending channel (yellow).
As the sellers stepped in at the $2.9-zone, EOS plunged into a down-channel (white). Now, the immediate testing point for the bulls stood at the upper trendline of the down-channel.
At press time, EOS was trading at $2.769. After declining alongside the down-channel, the RSI found resistance at the 43-mark. It displayed a bearish bias in the near term. Although the AO asserted a bearish bias, it flashed green bars, pointing at the slightly increasing buying power. Moreover, the CMF crossed the zero-line and hinted at increased money inflows.


