Ethereum Classic is at its April lows once more, but what of recovery

Disclaimer: The findings of the following article are the sole opinions of the writer and should not be considered investment advice
Observing a longer timeframe for Ethereum Classic, it was seen that the $28.6 area was a zone from which the price had rallied in mid-April. In early May, Ethereum Classic had a blow-off top at $179. Since then, Ethereum Classic has been on a steady downtrend.
On the hourly chart, Ethereum Classic was still trading within a bearish structure but had some bullish momentum behind it. Could it break the area of supply at $30?
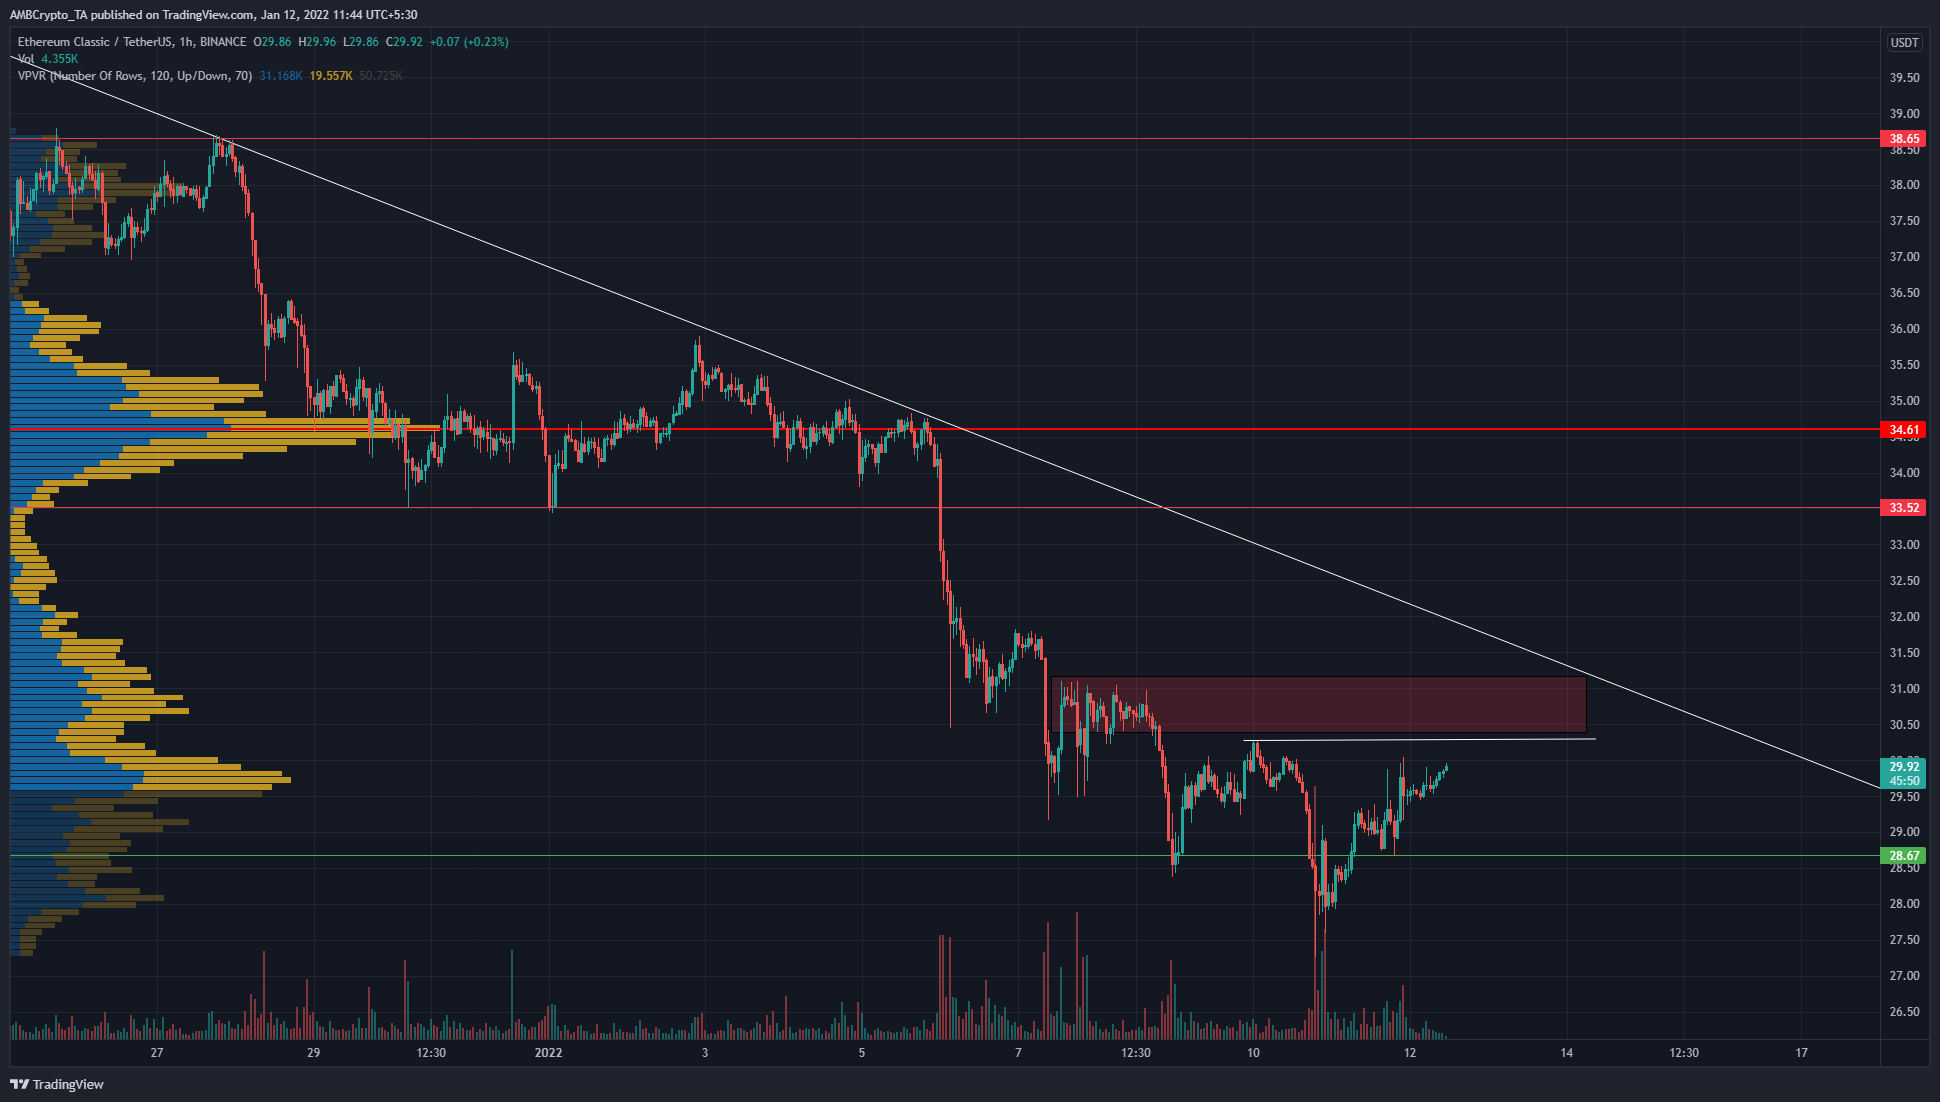
The trendline (white) resistance has been a resistance that the price has respected since mid-November. Each test of this resistance has been followed by a sharp rejection in subsequent days.
The Visible Range Volume Profile showed that the price was trading just below the Value Area Lows. This indicated that based on the volume profile, long positions can be considered. However, the market structure was still bearish as the most recent highs have not yet been taken out (marked with the horizontal).
Moreover, right above those recent highs of the past couple of days lay an area where sellers have been strong recently. Unless the price can flip this area from supply to demand, short-term bullish momentum might see a sharp reversal.
Rationale
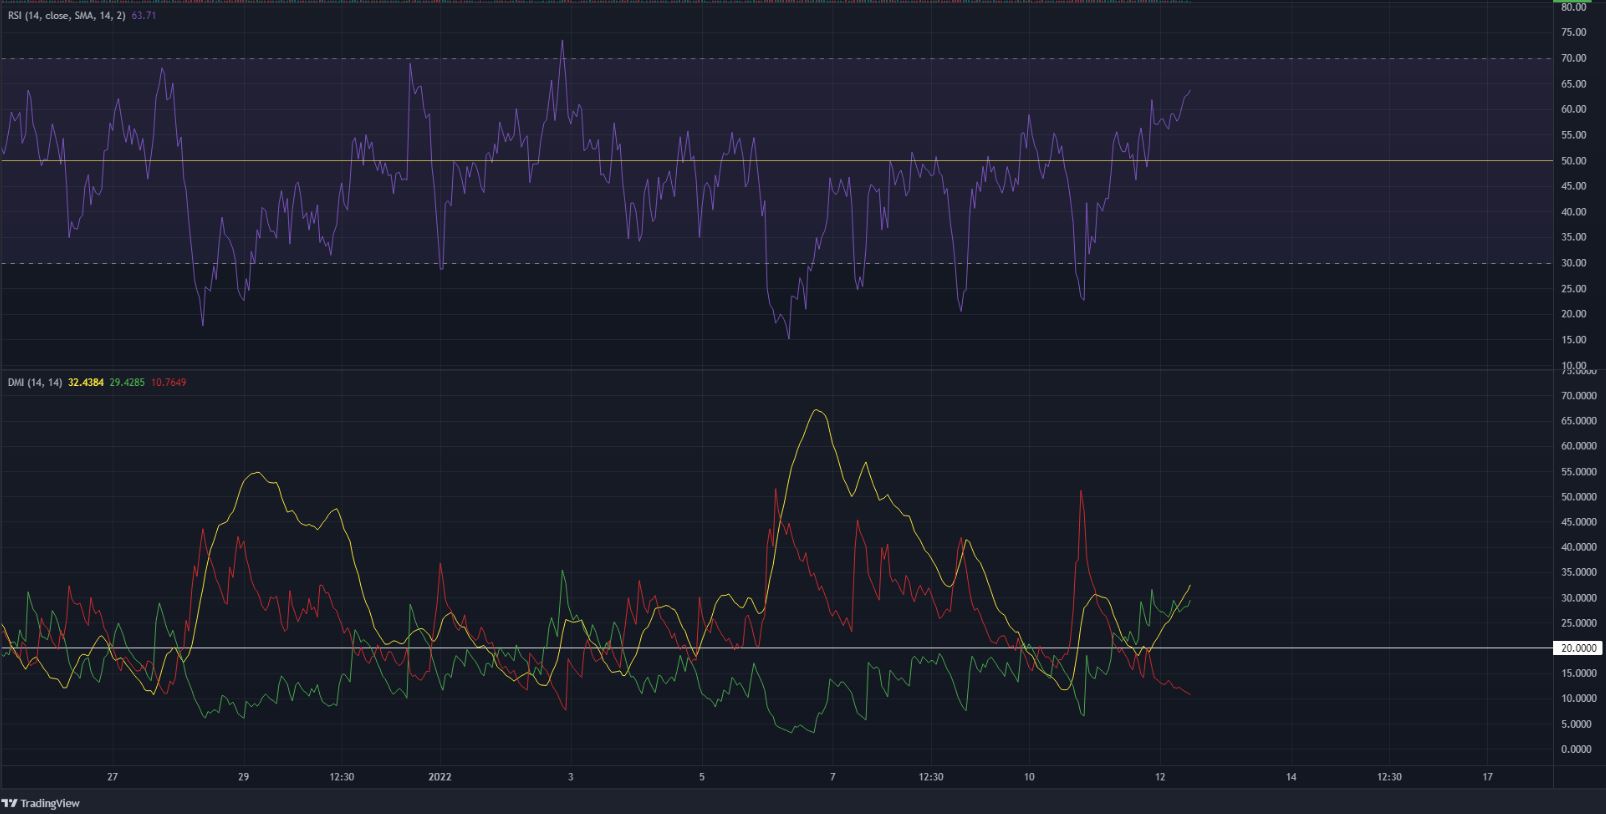
The RSI climbed past neutral 50 and suggested that bullish momentum was rising. The RSI on the hourly chart also climbed back above the 60-mark, something it had been unable to do for more than a week.
The Directional Movement Index pictured a strong bullish trend in progress as both the ADX (yellow) and the +DI (green) were well above 20 and climbing.
Conclusion
The indicators noted upward momentum, while the price also entered the Value Area Lows. Although a rule of thumb is to look for longs in this area, the short-term market structure remained bearish. ETC would have to climb above $30 and flip it from supply to demand before it can offer a buying opportunity.
There was also a longer-term trendline resistance to beat. However, in the event that it does, the entire area from $31.5 to $34.6 (Point of Control) could be quickly reclaimed by the bulls as there has not been much trading volume there in recent days to impede the price’s progress.


