Ethereum Classic: Short traders could benefit if this support fails to hold

Disclaimer: The information presented does not constitute financial, investment, trading, or other types of advice and is solely the writer’s opinion
- ETC price correction could break below $18.28 and settle at $17.60.
- A breakout above the bearish order block at $19.18 would invalidate the bias.
- ETC saw a slight decline in demand in the futures market.
Ethereum Classic [ETC)] rallied on 4 January, following Bitcoin’s [BTC] rally on the same day. ETC rose from $15.88 to $19.86, but a bearish order block at $19.86 undermined the further rally and forced a price correction.
The correction followed BTC’s pullback from the $16.95K high reached on 4 January. At press time, ETC was trading at $18.51 after retesting previous support at $18.28.
Although ETC was extremely bullish on the 12-hour chart, it had reached the overbought zone and could see further price reversal (downtrend). Such a move could provide traders with additional opportunities to sell at these levels.
Read Ethereum Classic’s [ETC] Price Prediction 2023-24
Support at $18.28: Can the bears break below it?
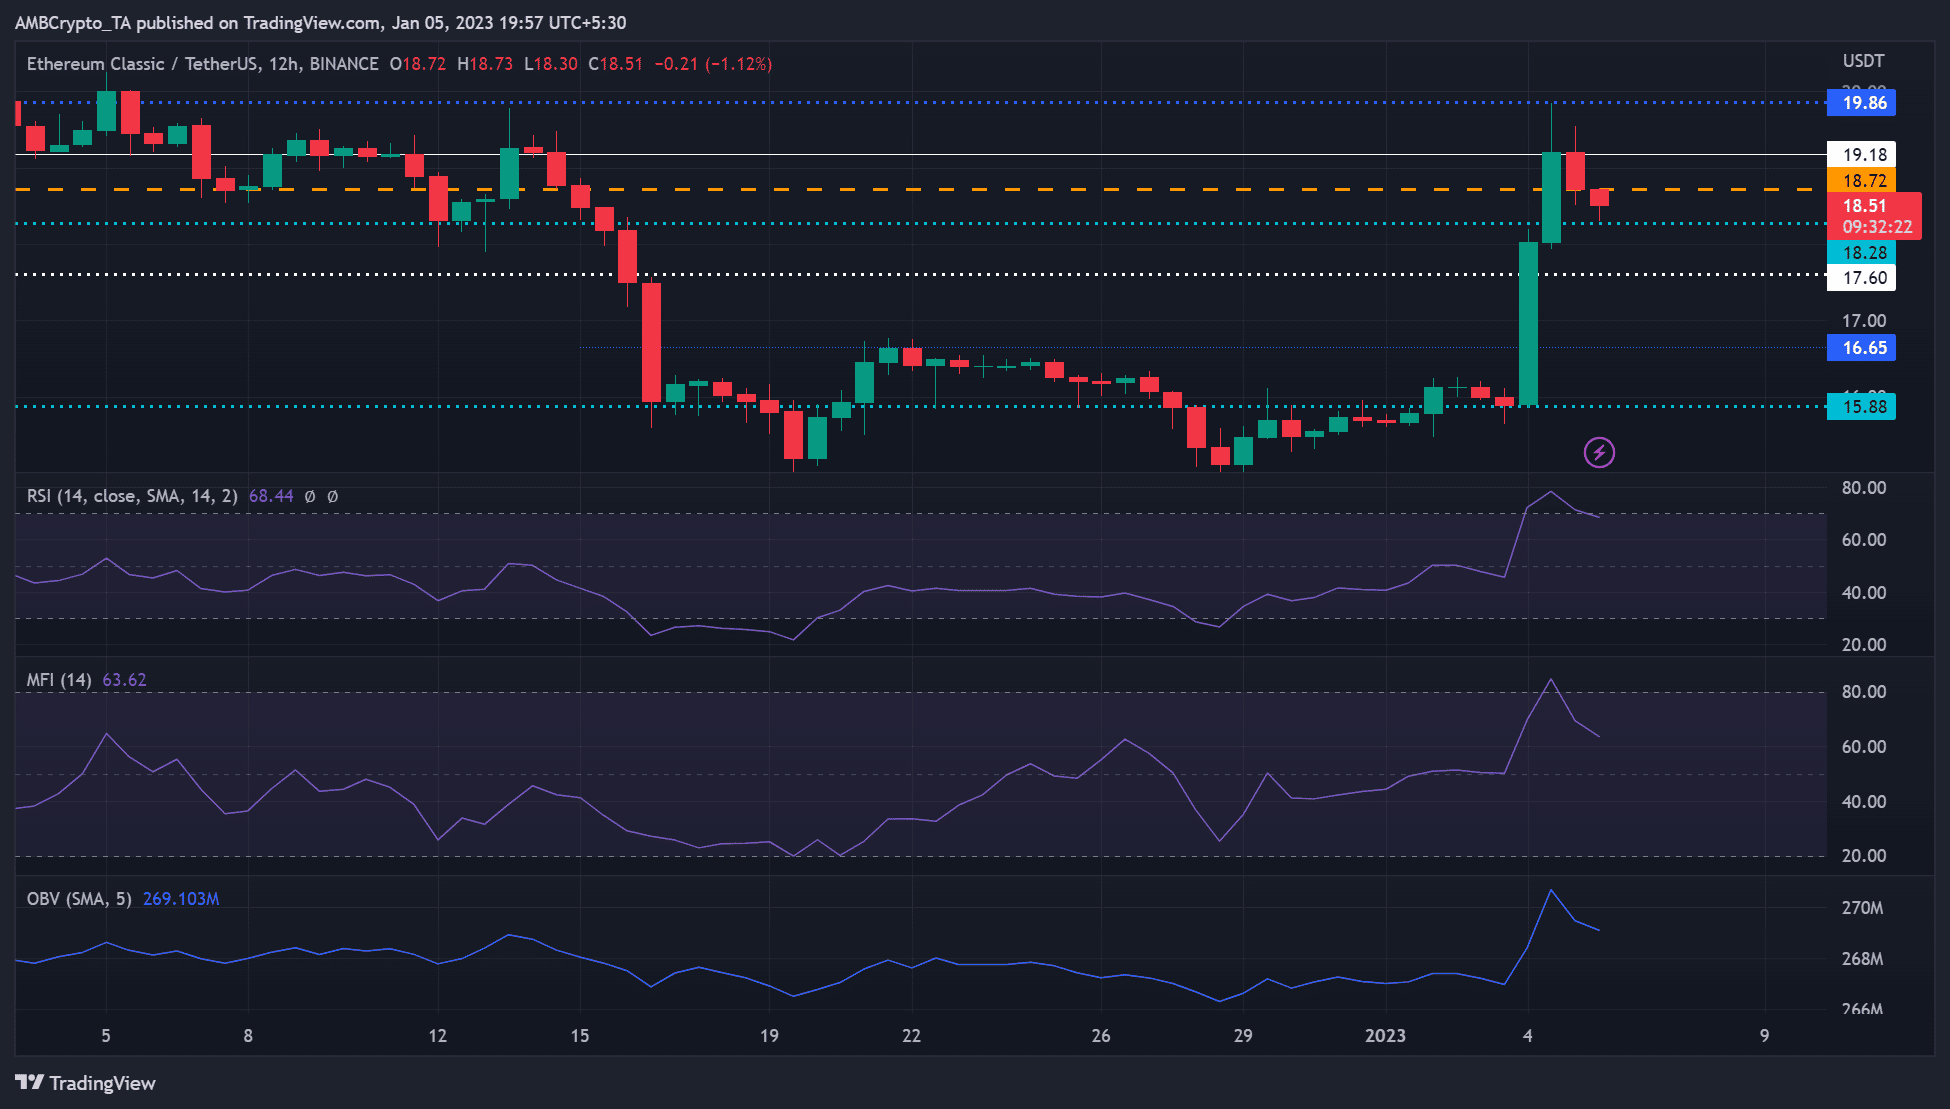
All three technical indicators (RSI, MFI, and OBV) point to a further downtrend. The Relative Strength Index (RSI) pulled back from overbought territory, a sign of easing buying pressure.
Similarly, the Money Flow Index (MFI) had reached the overbought area and was moving down. This shows that accumulation peaked and distribution was underway. In addition, the on-balance volume (OBV) has fallen sharply, so buying pressure may be limited.
These changes would give bears more room to push ETC prices down. Therefore, ETC could break below $18.28 and settle at $17.60. Short traders can sell high and buy back if ETC reaches $17.60.
However, a bullish BTC could push ETC to break the bearish order block at $19.18. Such a move would invalidate the bearish bias above.
ETC saw a decline in open interest and trading volume
ETC experienced a divergence between open interest (OI) and price on 3 January, which was followed by an upswing in price on 4 January.
However, at press time, open interest (OI) fell as ETC prices fell, indicating a decline in open trading positions in the derivatives market. This bearish outlook in the derivatives market could put downward pressure on the price of ETC if it continues.
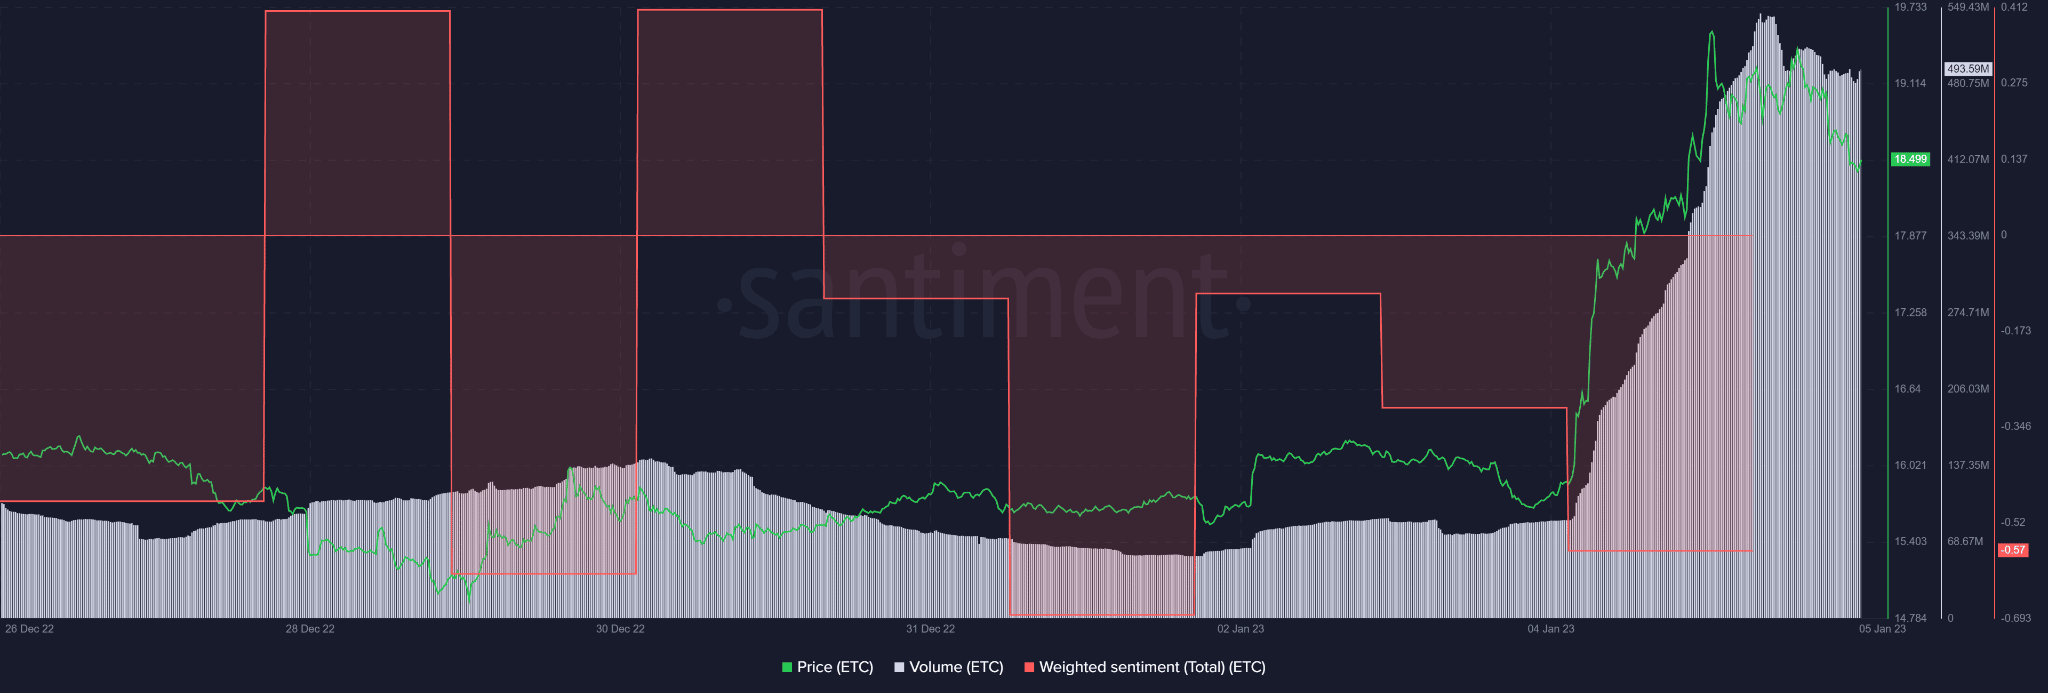
In addition, increased negative sentiment and a slight decline in trading volumes, as indicated by Santiment, could undermine further buying pressure and give more leverage to sellers.
Are your holdings flashing red or green? Check the ETC Profit Calculator
Nevertheless, a bullish BTC will boost ETC to overcome the bearish order block, hence worth tracking.