Ethereum Classic – This may be the answer to the question ‘To HODL or sell’

Disclaimer: The findings of the following analysis are the sole opinions of the writer and should not be considered investment advice
Ethereum Classic (ETC) continued its retracement until its 11-month support around the $24-zone. Since then, the bulls have initiated a steady recovery on the charts.
Now, with the 20 EMA and the Point of Control (POC, red) posing as impediments for the bulls, ETC seemed to be looking ahead to a squeeze phase before making a trend-committing move. The $26-support is critical for the bulls to hold on to avoid a fallout towards the $25-level.
At press time, ETC was trading at $26.47.
ETC 4-hour chart

After moving sideways for the better half of last year, ETC lost the vital $30-mark as the bears flipped it to resistance. The alt lost over 45% of its value (from 27 December) as it dipped towards its nine-month low on 22 January.
ETC has noted decent gains since its January lows and witnessed a bullish trendline support (white, dashed). Although it marked higher troughs, the bears kept the peaks in their control. Thus, squeezing ETC in a symmetrical triangle-like pattern. After the recent down-channel (yellow) breakout, the bears quickly took over and kept ETC below its EMA ribbons.
From here on, a confluence of multiple resistances makes the recovery path onerous. Any close above its trendline resistance (white) could propel a $27-mark retest. Should the current candlestick close as green, that would affirm a potential morning star candlestick pattern.
But with the current momentum, ETC would likely continue its low volatility phase and test its trendline support. To turn the tide in their favor, the bulls still need to find a close above the POC.
Rationale
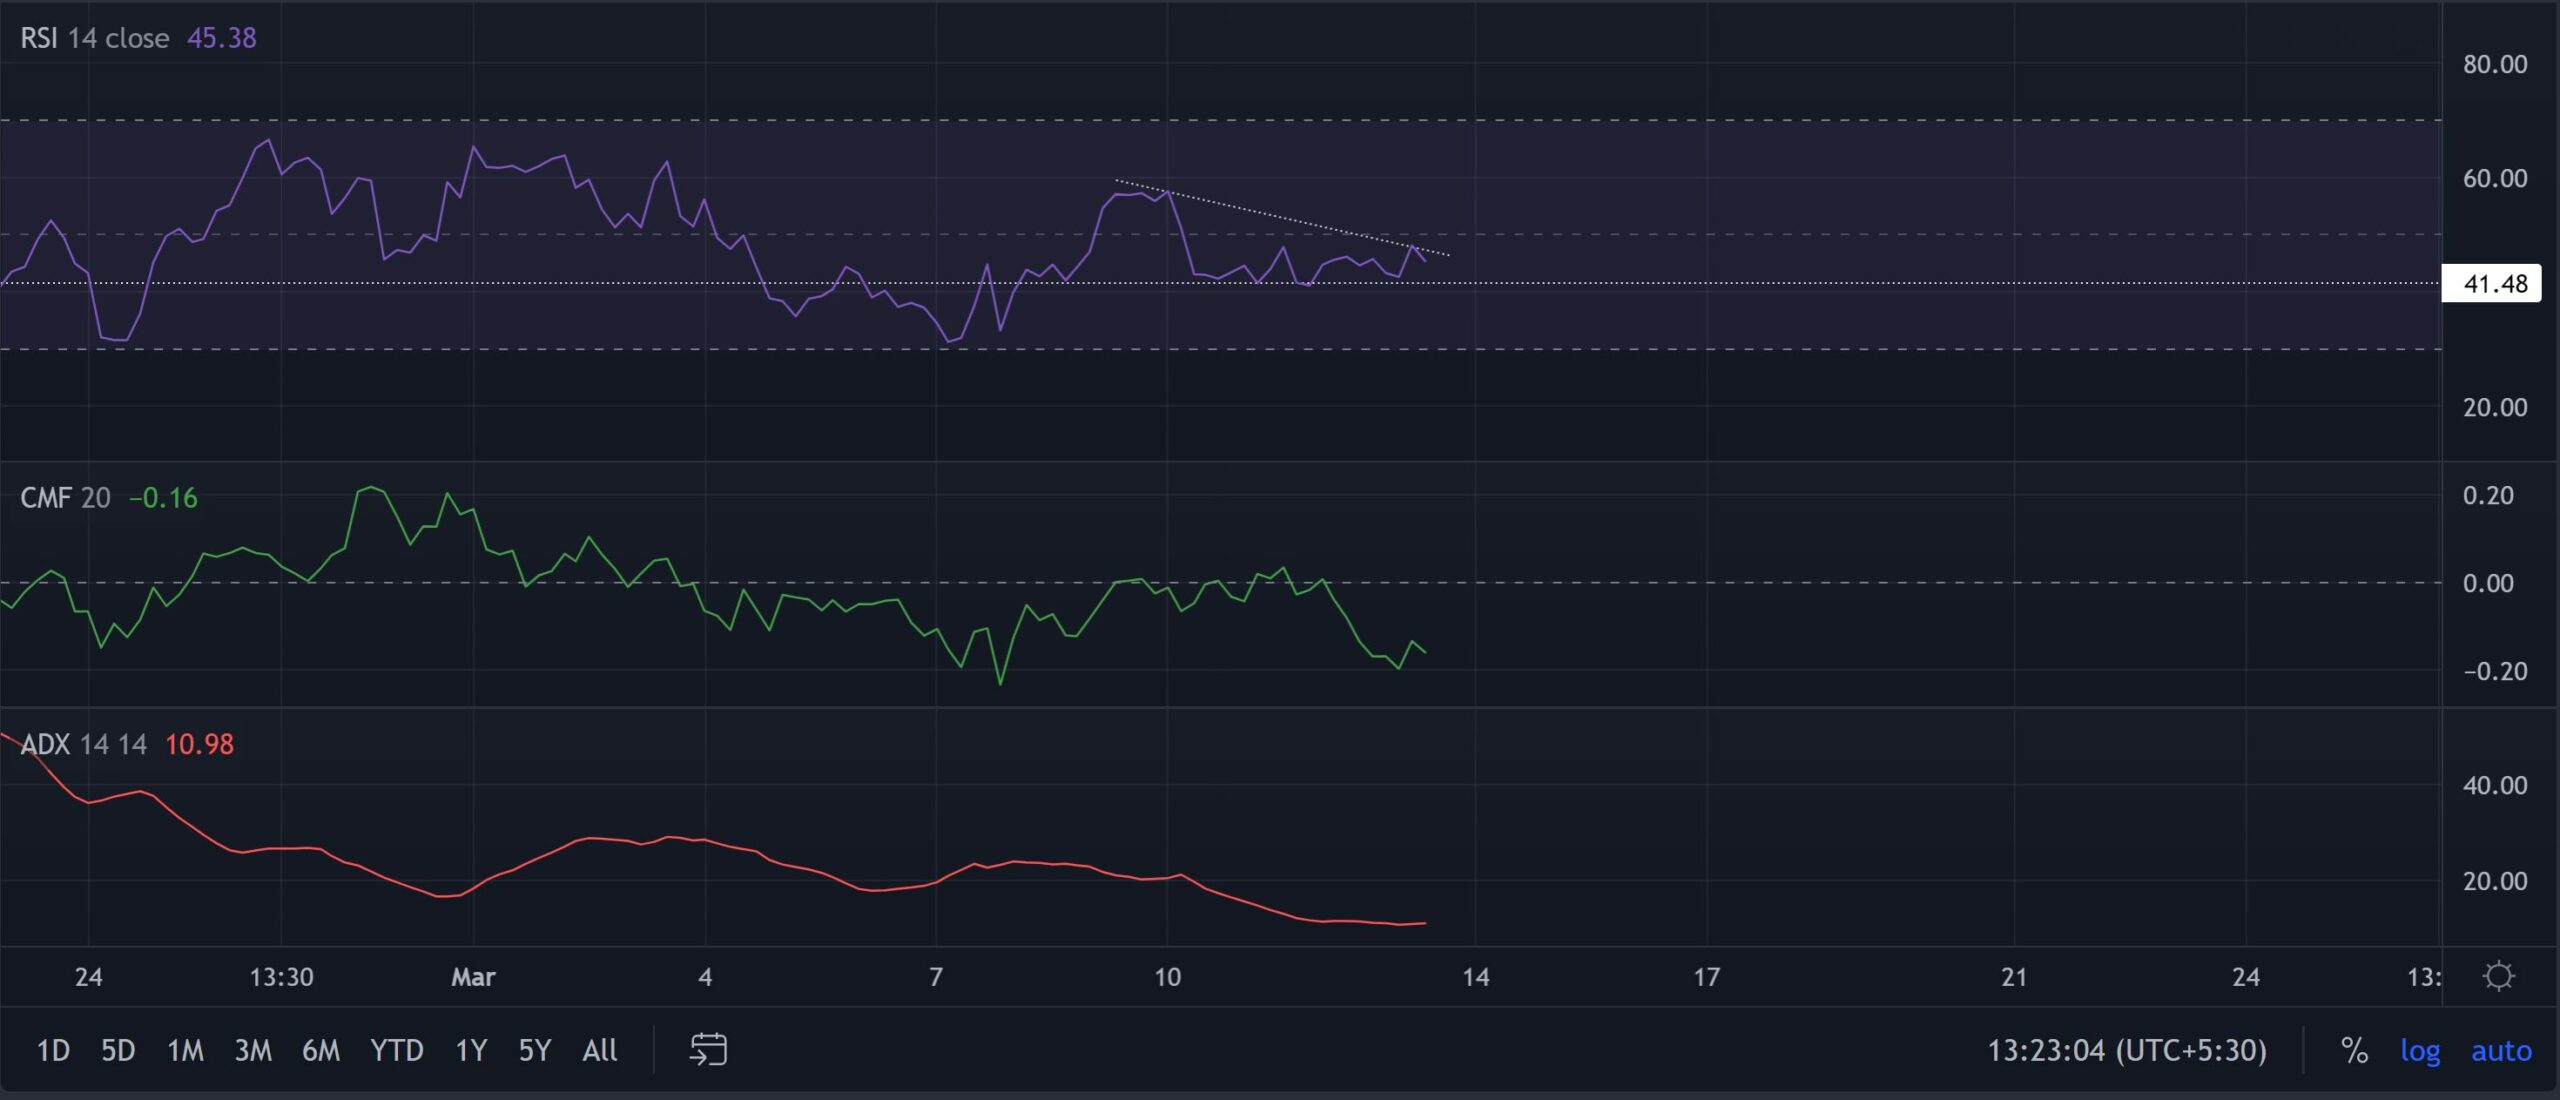
The RSI hovered below the midline and pictured a bearish bias. Over the last three days, it formed a descending triangle on its 4-hour chart. This reiterated the rise in selling influence. Also, the CMF was southbound and confirmed the decreasing money flows. Nevertheless, the ADX was on a downtrend and revealed an extremely weak directional trend.
Conclusion
Traders/investors must now look for a confirmation on the bullish morning star candlestick pattern. The POC would serve as an important area of value in the coming days. A likely close below this level would set ETC for a re-test of its support before entering a highly volatile phase.
Besides, the broader market sentiment and on-chain developments would play a vital role in influencing future movements.


