Ethereum Classic: This pattern could be key to a 30% hike

Disclaimer: The findings of the following analysis are the sole opinions of the writer and should not be taken as investment advice
Ethereum Classic has not been in the best of shapes of late. Multiple bearish patterns combined with a lack of pushbacks at support levels have hurt its price progression on the charts. As a result, the alt was trading at a 43% discount when compared to its September high of $77.4.
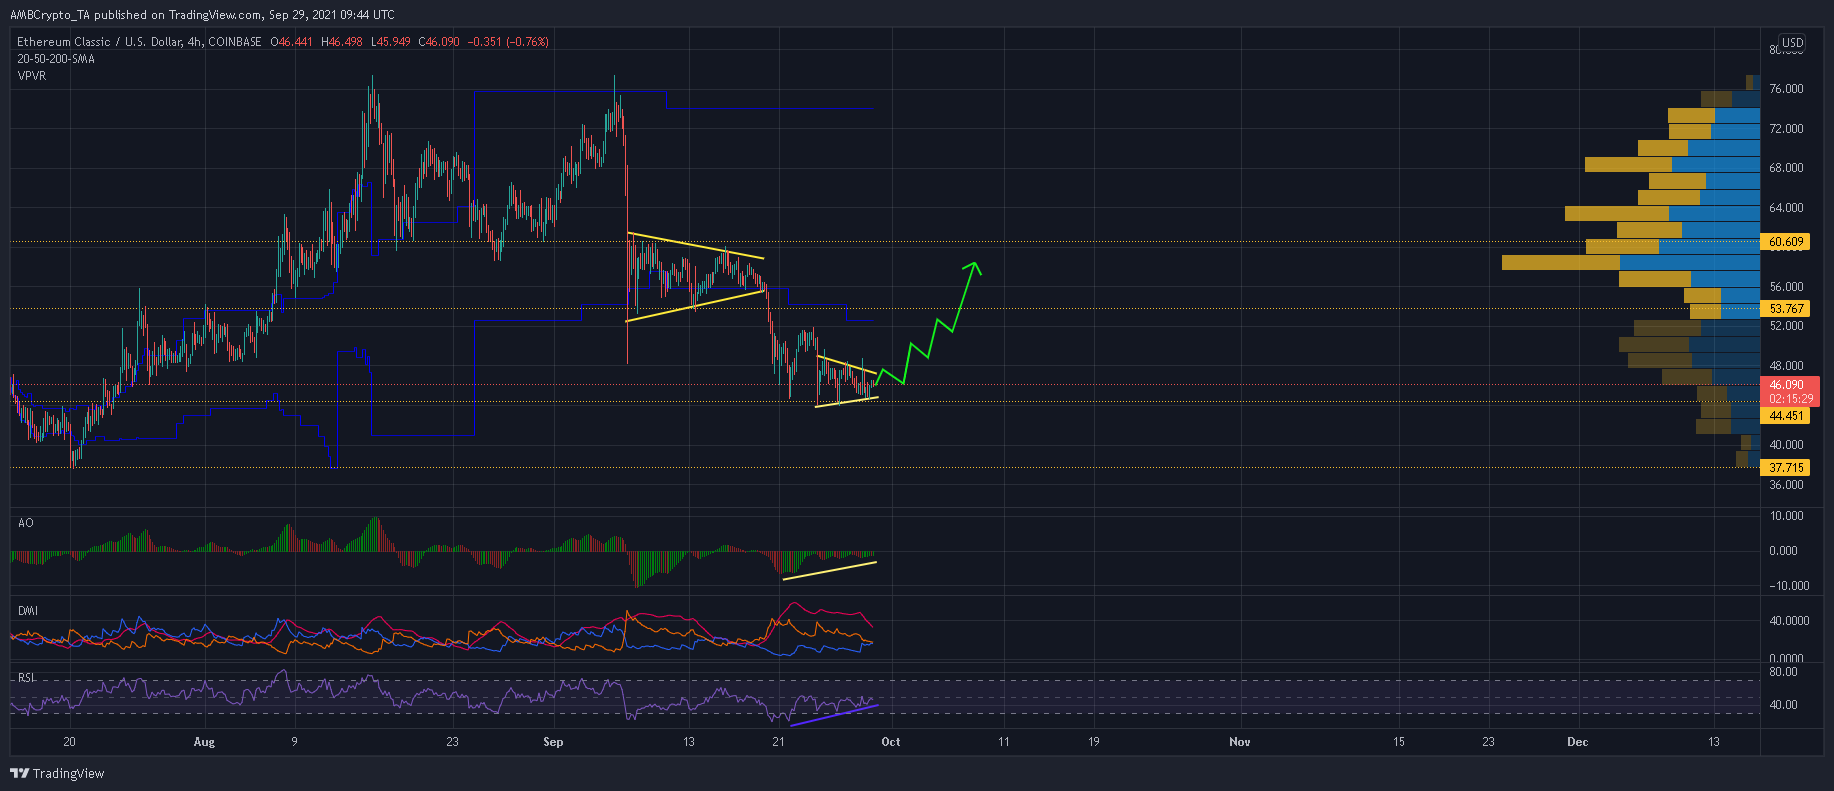
From here, chances of a much-needed rally would depend on how buyers react to another symmetrical triangle setup on ETC’s 4-hour timeframe.
At the time of writing, ETC was trading at $46, up by just 0.5% over the last 24 hours.
Ethereum Classic 4-hour Chart
A bearish double top at $77.3 and a resulting symmetrical triangle did not bode well for Ethereum Classic. After these patterns triggered a breakdown, ETC declined by over 40% over the past three weeks. Moreover, no pushbacks were offered at $60.6 and the $53.8-support. This allowed sellers to pile on more pressure. This plummet saw ETC close below its value zone – A region where over 70% of the trades were placed in a given timeframe.
Now. a move below this zone tends to attract institutional traders who look for discounted buy opportunities. With another symmetrical triangle in formation, buyers seemed to have an ideal platform to step in at the $44.5-support and trigger a break to the upside. From there a close above $53.7 would open a route towards the $60-mark, resulting in a 30% hike.
However, if ETC slices through the $44.5-support, a retracement to July’s swing low of $37.7 will be possible. Overall, this represented a 15% fall from ETC’s press-time level.
Reasoning
Meanwhile, several bullish divergences were spotted on ETC’s indicators. The Relative Strength Index formed a series of higher lows and challenged the mid-line – A sign that buying pressure was picking up in the market. Bullish twin peaks were also spotted on the Awesome Oscillator – A positive sign.
Finally, the Directional Movement Index was close to a favorable crossover – Yet another signal which played in favor of the bulls.
Conclusion
Ethereum Classic had the potential for a 30% hike on the back of a symmetrical triangle breakout. In fact, several other developments mentioned above seemed to work in favor of bullish traders too.
However, support from the broader market is needed to fully realize ETC’s potential. If sellers intervene, ETC risks a decline to its July swing low of $37.7.


