Ethereum Classic’s 40% bearish correction from March peak reveal increased…

Ethereum Classic has been on a shark bearish trajectory for almost four weeks and it managed to extend its downside by 40% on 25 April from its latest local top. ETC’s bearish pullback started after its 29 March peak which concluded an impressive bull run from mid-March.
ETC dipped as low as $31.38 in the last 24 hours of 25 April, at which point its retracement reached 40% from the March high. A noteworthy performance because it crossed below the 61.8% Fibonacci retracement line. However, it has so far registered some upside and is currently trading at $32.79.
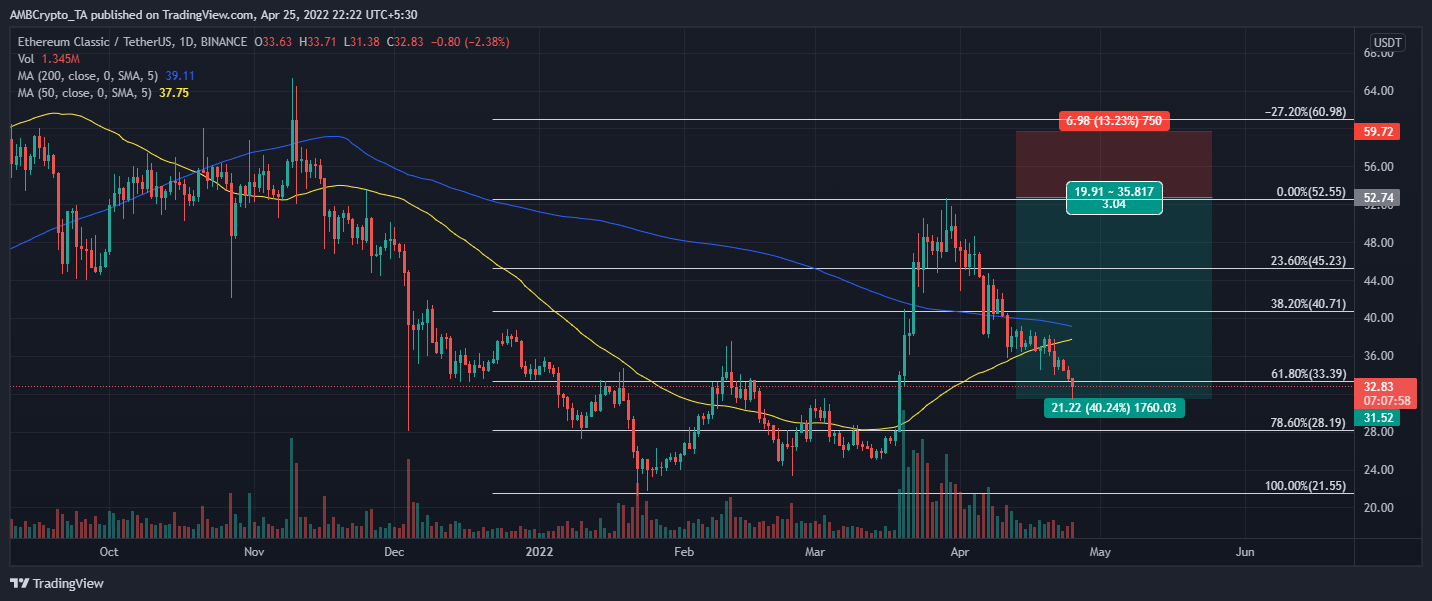
The 61.8% Fibonacci retracement line aligns with the $33.35 price level which has previously been tested as a support and resistance level.
It is thus possible that it might also act as Ethereum Classic’s next trend reversal zone, especially after a 40% retracement. Such a significant pullback is eventually bound to experience trend exhaustion.
Will ETC reverse near its current price zone?
While ETC’s current performance suggests the likelihood of a reversal at the 61.8% Fibonacci level, on-chain activities offer more clarity. Ethereum Classic’s total supply held by whales metrics registered a noteworthy uptick between 23 and 24 April.
The total supply held by whales went up from 51.69% to 52.11%, hence a substantial accumulation.
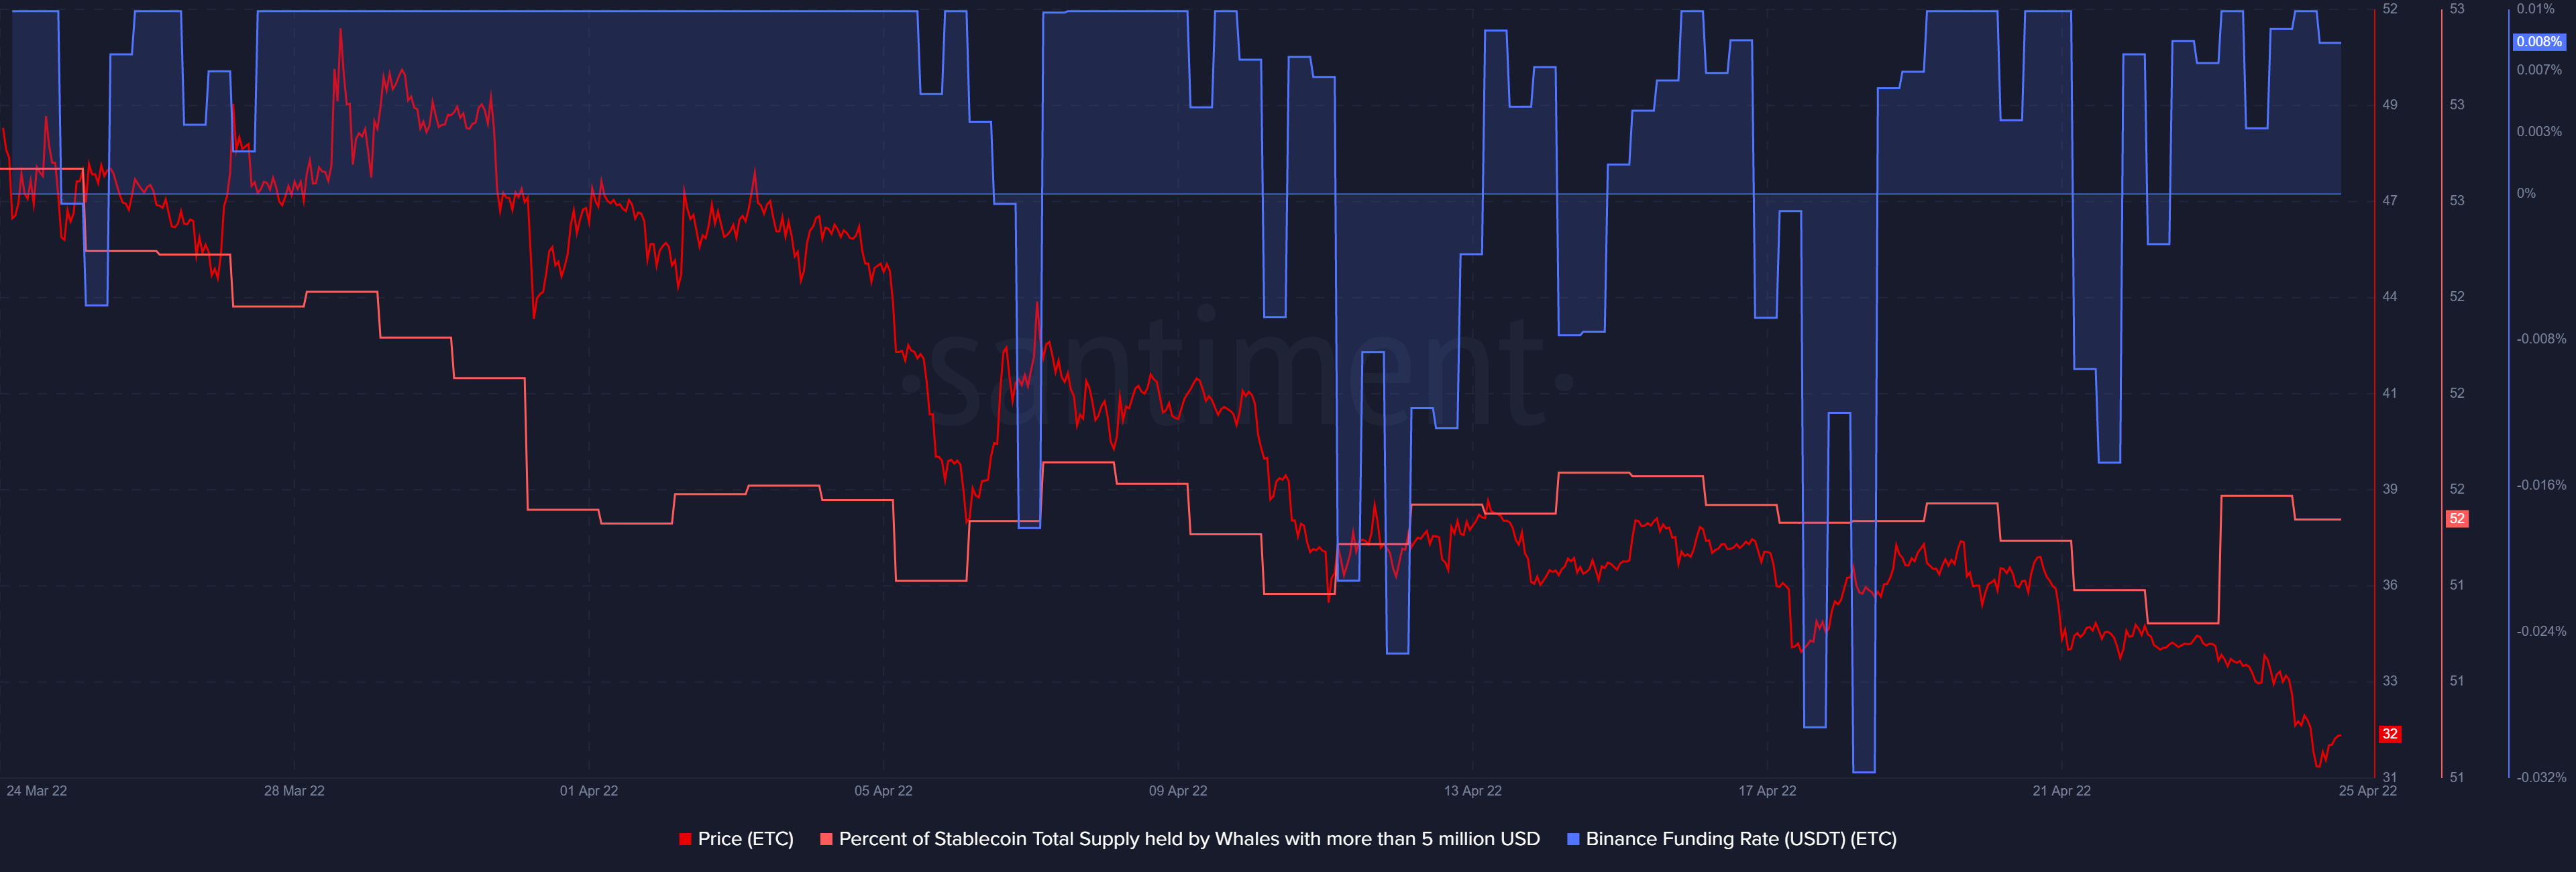
The Binance futures funding rate metric shifted from negative to positive between 17-25 April. While it does not directly mean that the price will go up, it highlights increased long positions in the derivatives market. This means derivatives investors are shifting to a bullish sentiment as the price continues to go down.
If ETC achieves a bullish reversal, it will likely encounter some friction near the $37 which is the mid-point between the 61.8% and 38.2% Fibonacci retracement lines.
A strong upside move would likely encounter support at $40 which sits on the 38.2% Fibonacci line. A bearish performance will find support near the $28 price level which overlaps with the 78.6% Fibonacci line.


