Ethereum, Cosmos, FTX Token: 28 January

Over the course of the week, the larger crypto-market saw a slump in bullish momentum. With Bitcoin continuing to trade around the $32k-level, many of the market’s altcoins also saw a lot of sideways movement on the charts.
Ethereum [ETH]
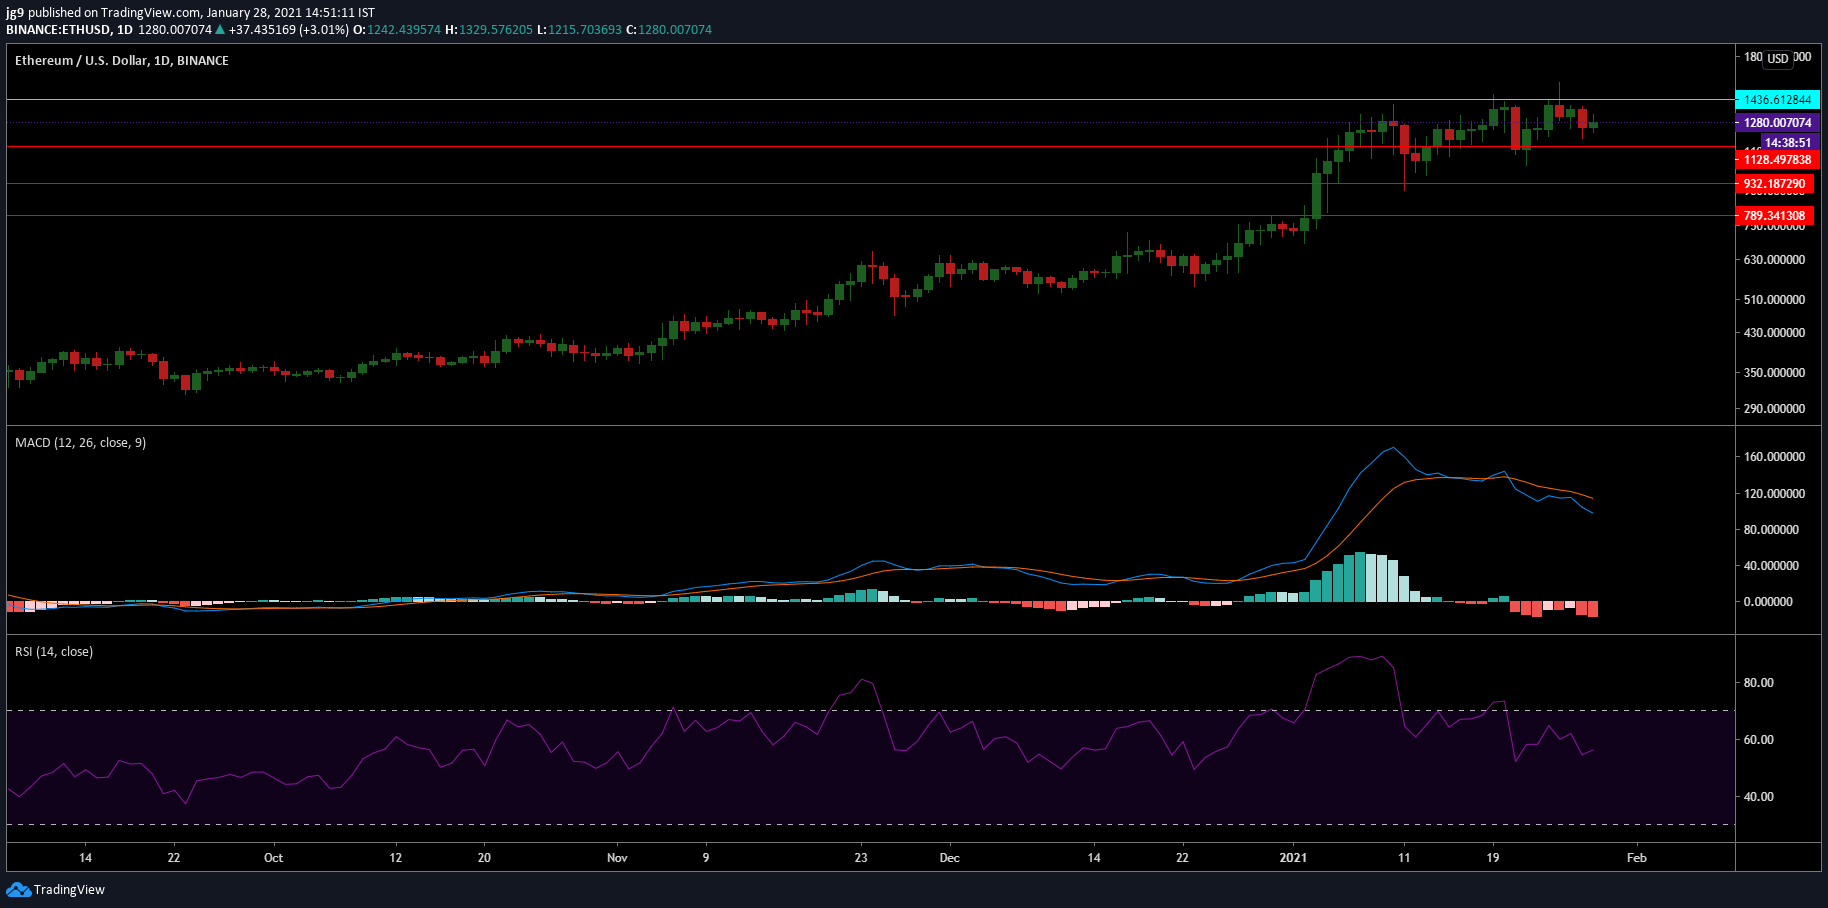
Ethereum, at press time, was trading at $1,266.8, with ETH registering a minor correction of close to 2 percent on the price charts in 24 hours. At press time, the coin had a 24-hour trading volume of $38 billion and a market cap of $146 billion.
For most of the month, the coin has traded between the confines of its immediate resistance at $1,436 and its immediate support at $1,128. There were also two other strong levels of support at $932 and $739 if the bears were to induce yet another price correction.
The technical indicators for ETH presented mixed signals. The MACD indicator was bearish after its Signal line went over the MACD line, and at press time, there still seemed to be no signs of a reversal taking place. The RSI, on the other hand, was moving closer to the overbought zone and indicated that there could be some momentum behind the coin’s price.
ETH was in the news recently after investor documents revealed that Galaxy Digital is planning to launch ETH-focused funds next month.
Cosmos [ATOM]
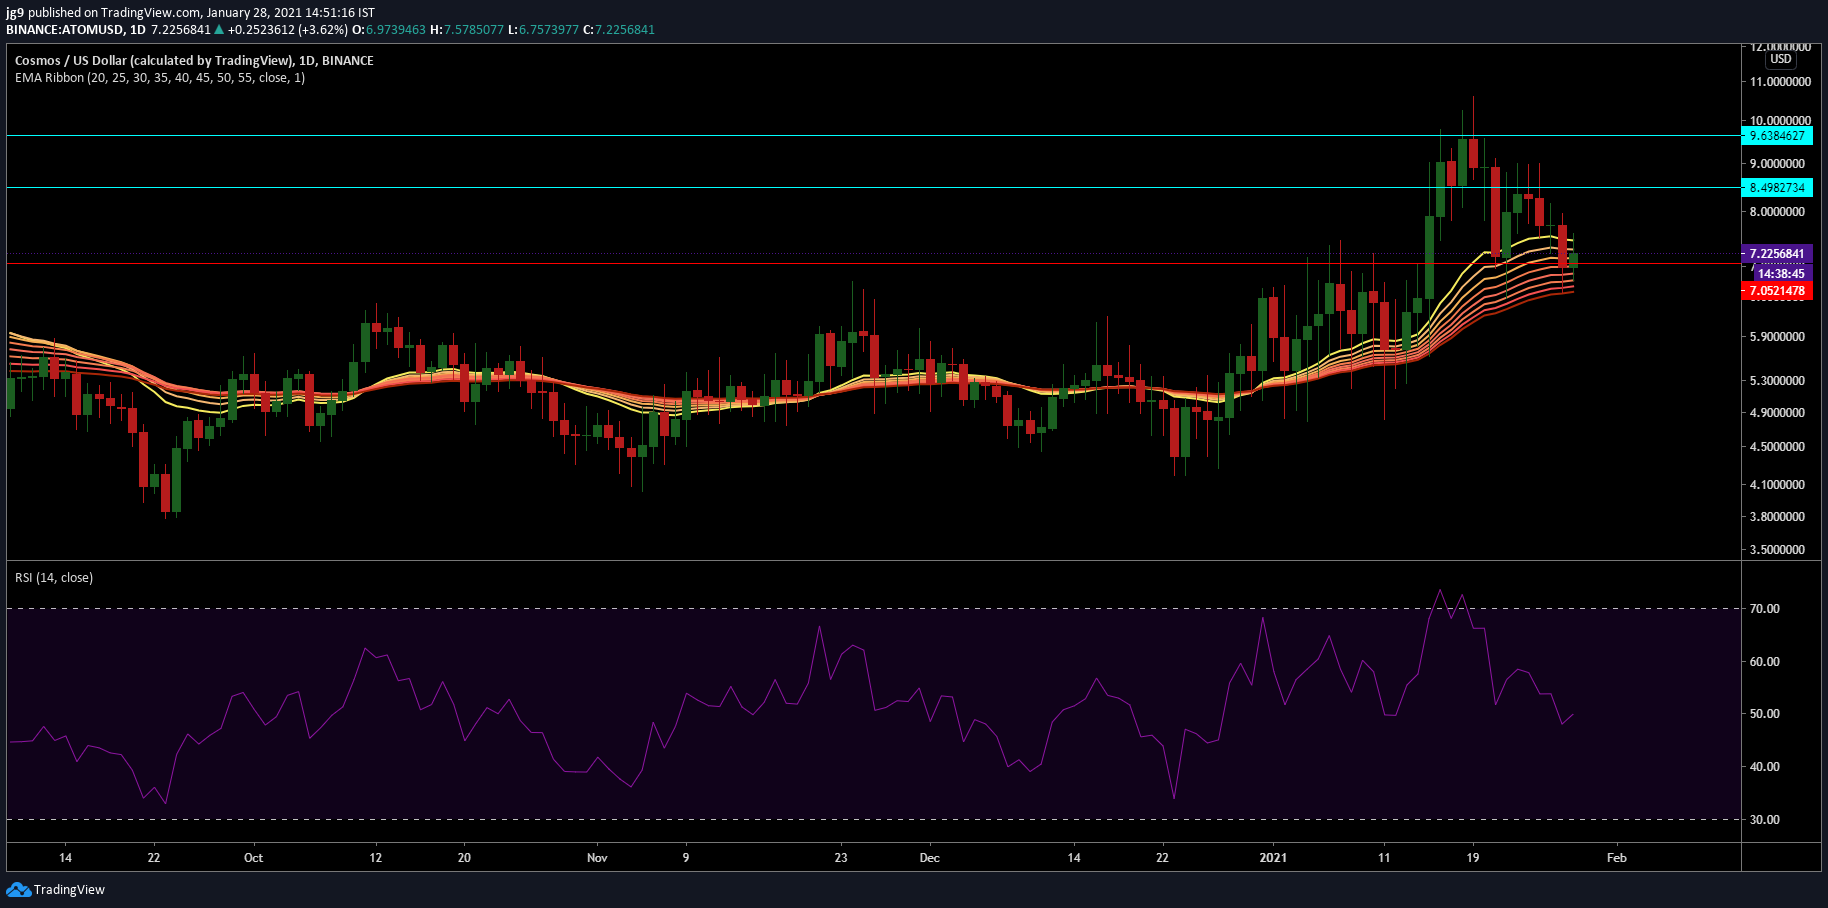
Cosmos, at press time, was ranked 27th on CoinMarketCap’s list, with the same trading at $7.17, at press time. The previous week saw its price decline by over 14 percent and if the coin goes on a strong recovery run, then it would have to breach two key levels of resistance at $8.4 and $9.6. However, if the price settles around its press time valuation and a downtrend occurs, it can count on the press time price range to offer a bit of support.
The EMA ribbons settled around ATOM’s press time trading price and will help in avoiding a further dip in value. Further, the RSI indicator remained in the neutral zone.
FTX Token [FTT]
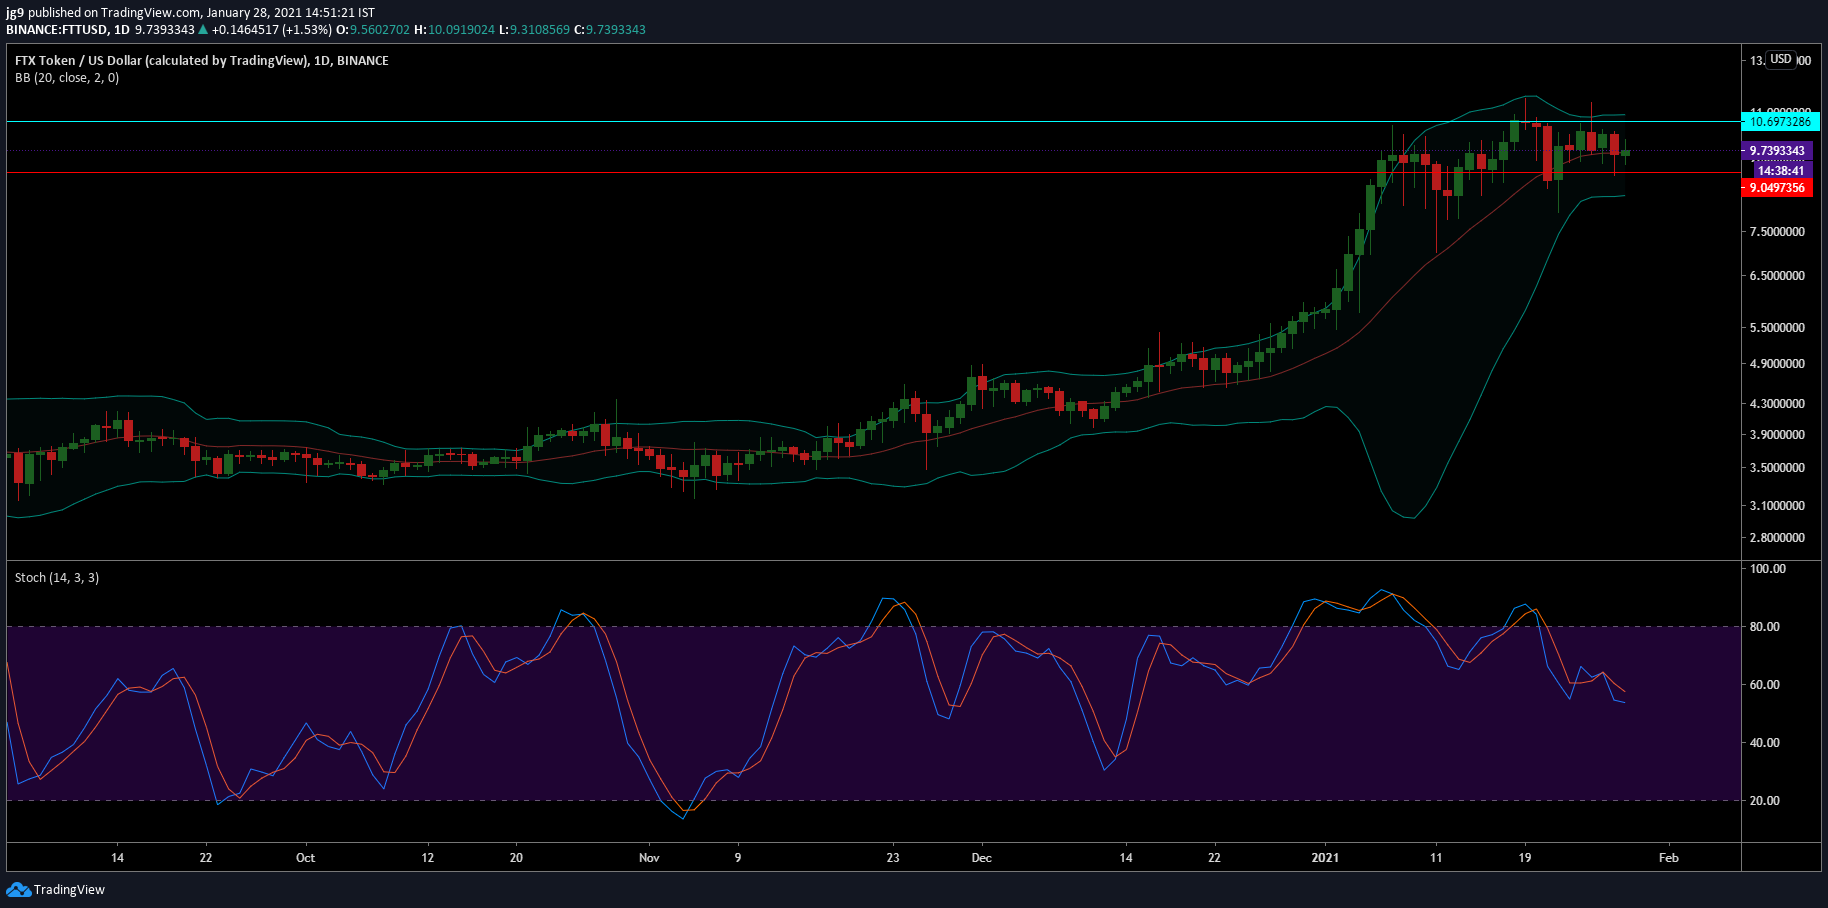
After the massive price drop on 21 January, FTT has traded mostly sideways, according to its 1-day chart. The coin, at press time, was valued at $2.8, with the cryptocurrency having a market cap of $917 million. In order to break out of this range, FTT will have to breach the resistance at $10.6, and in case that fails, it can count on the support at $9 to help stabilize the price.
The Bollinger Bands underlined the market’s low volatility since the bands were contracting on the charts. The Stochastic indicator underwent a bearish crossover, with the same heading towards the oversold zone at press time.


