Ethereum: Did recent gains even make a difference?

To many, Ethereum is a cause for concern right now since its price action, despite recent recovery efforts, hasn’t by and large been in the right direction. In fact, not only is the world’s largest altcoin losing investors, but it is also losing a lot of money from the market.
ETH’s market capitalization, for instance, has fallen by 21.6% in the last 21 days. Despite some gains over the last 24 hours, does the bigger picture point to a possible breakdown in ETH’s price going forward?
Ethereum to fall once again?
Although the coin did not manage to hold its position consistently on the charts, at least it saved itself from falling much further before gains set in. According to popular analyst Rekt Capital, for instance, the altcoin fell through its wedging structure. This wedging structure had allowed the coin to consolidate within the trend lines and for the most part, it is expected to break above it and engage in a rally.
“ETH is breaking down from its blue wedging structure.
Price is now posing pressure on the orange support area, which is where #ETH rebounded from twice before over the past couple of months.
A rebound could happen here but it may be weaker than before”
As highlighted previously, a rebound did come in the form of the larger market recovering somewhat on the price charts. Whether it will be weak, however, is a question for another time.
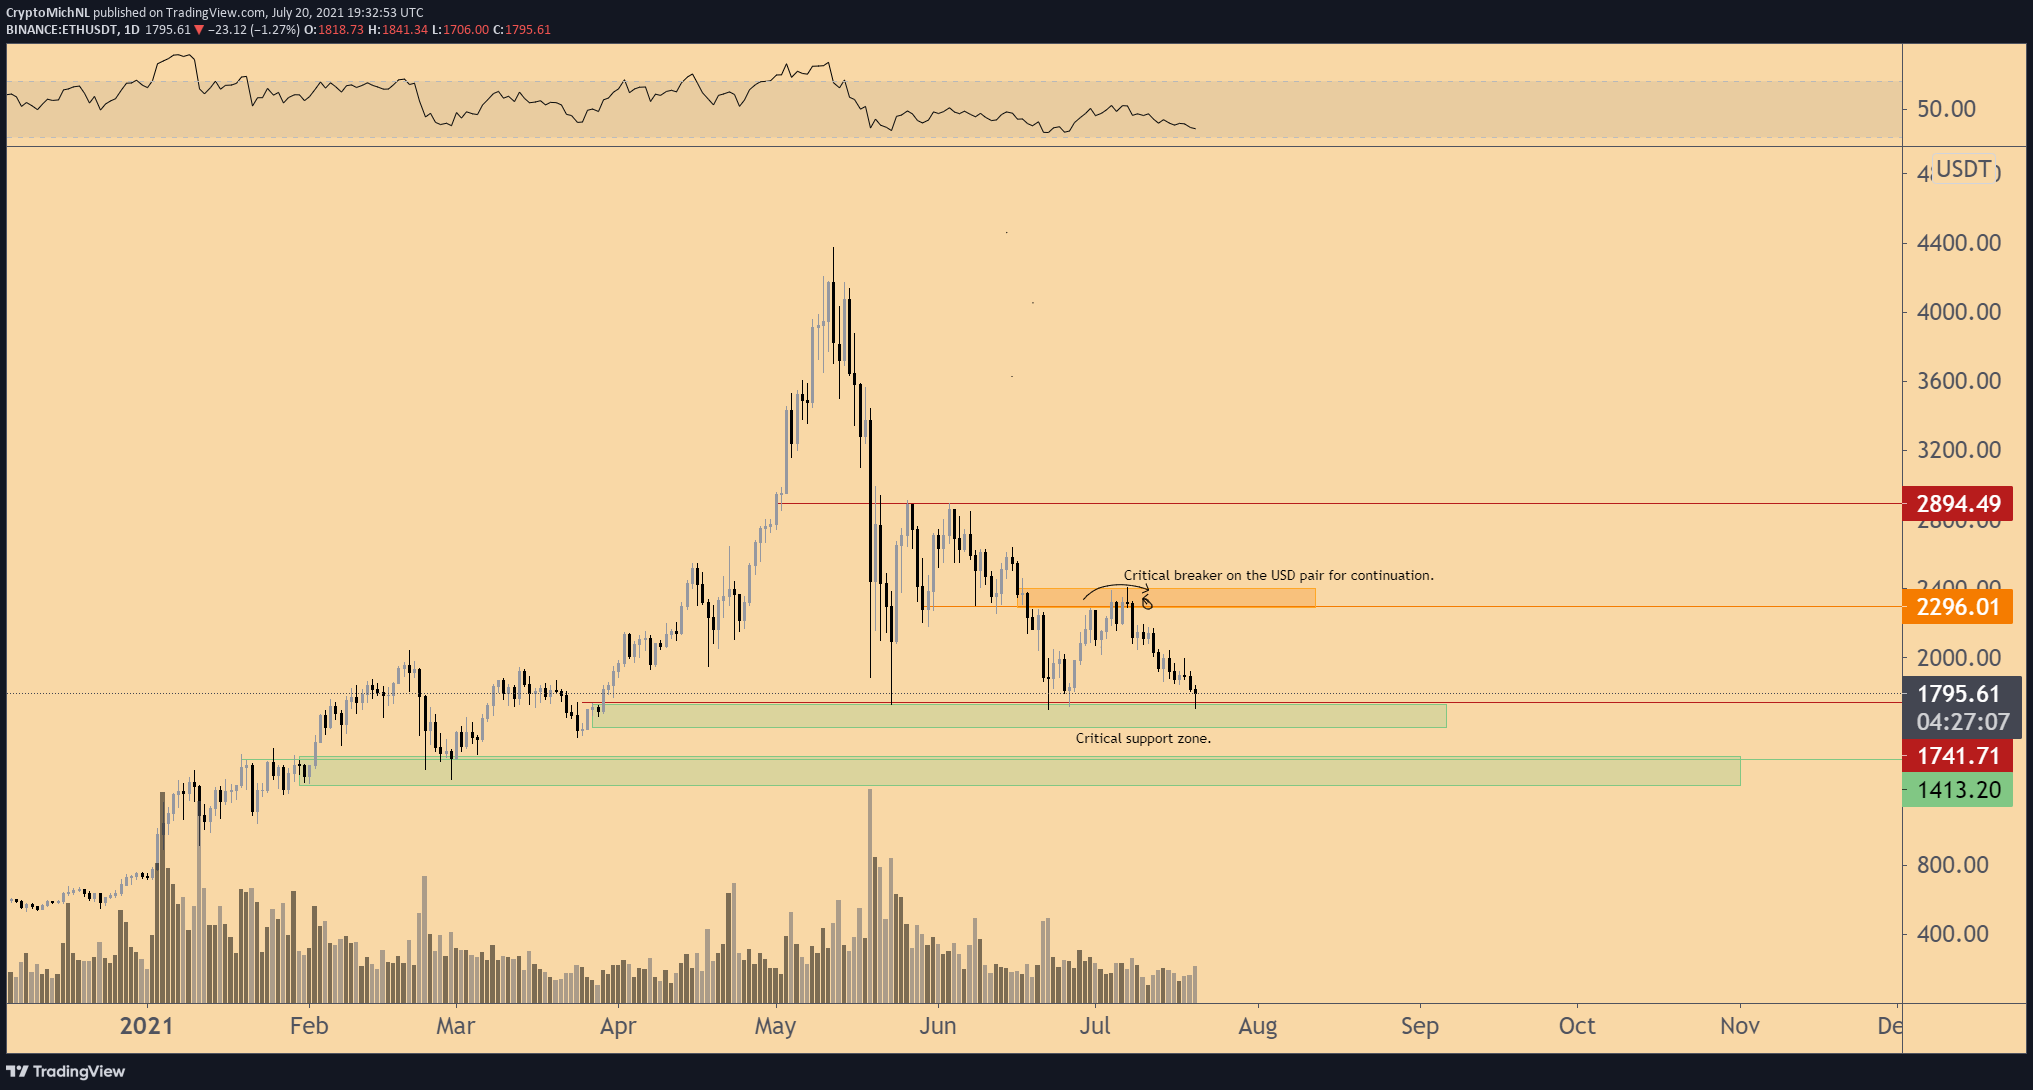
Since that didn’t work out, it’s best to think small and in a lesser complicated way. Analyst Michael Van de Poppe simply mentioned the very important levels for the altcoin. If Ethereum does fall back to its previous levels again, critical support can be expected to remain at the $1500-$1700 range. However, the critical breaker will maintain its position at $2400.
Even metrics agree
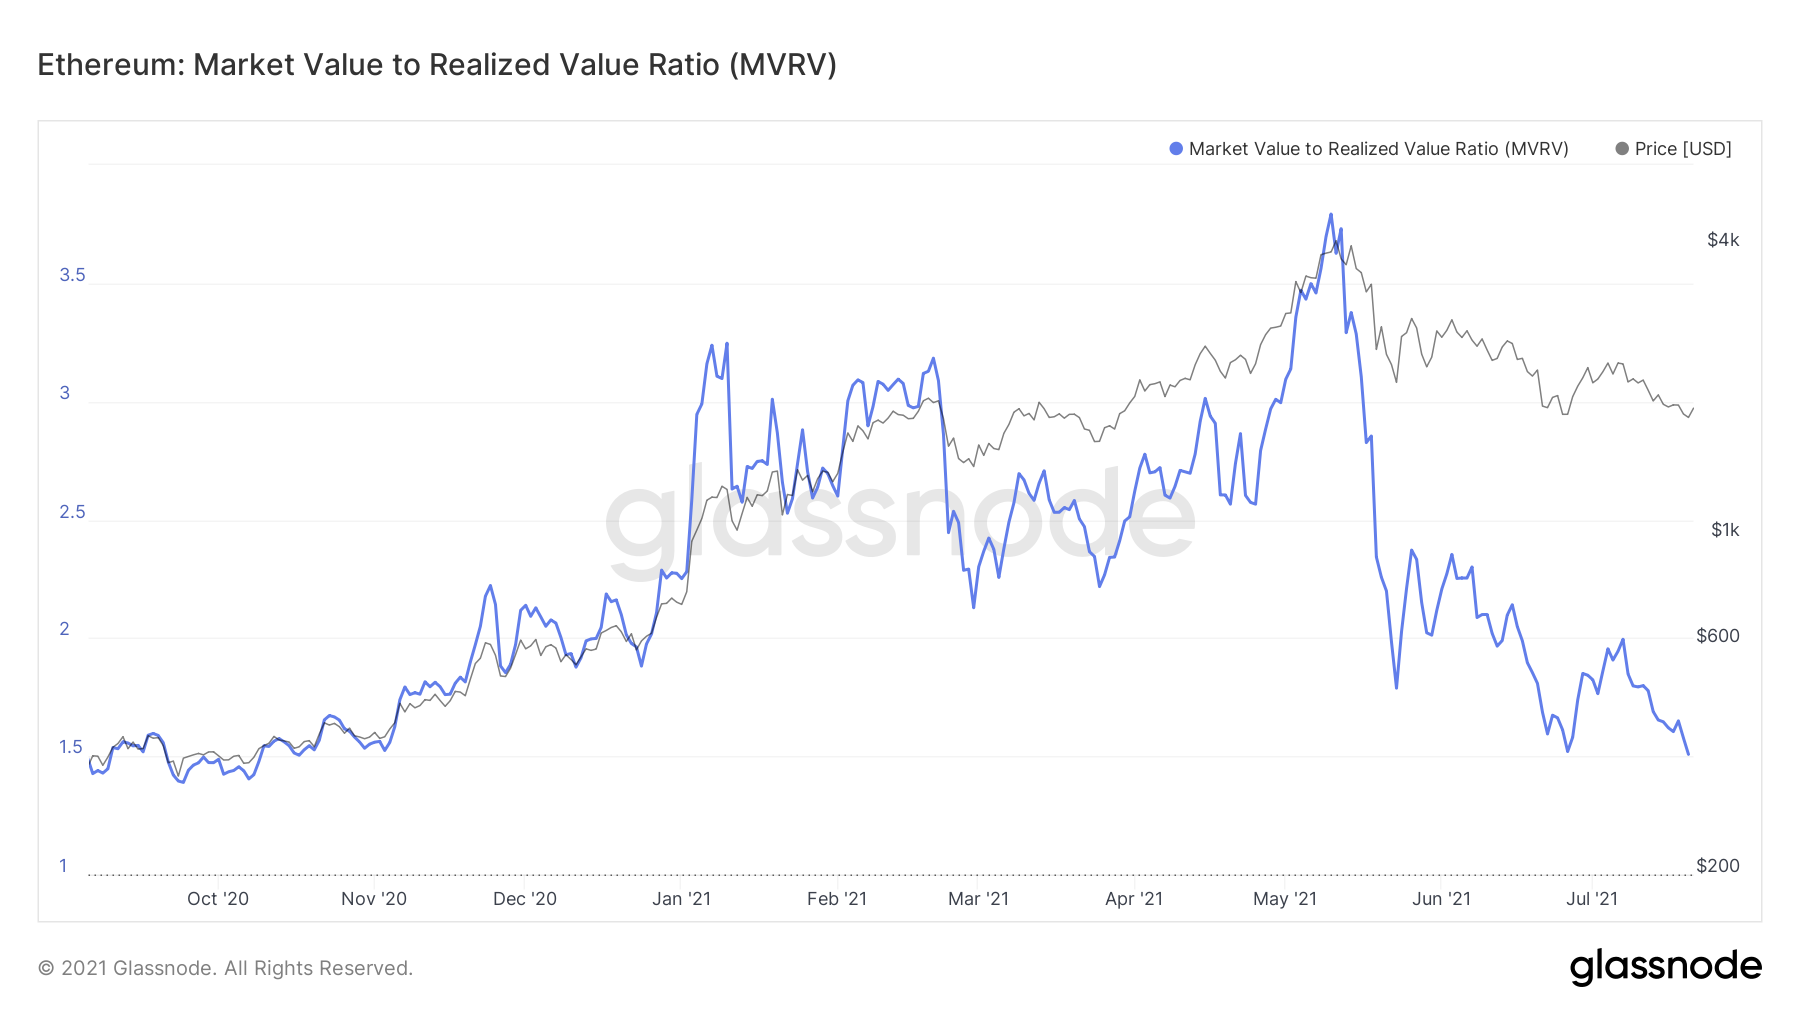
Despite its gains over the last 24 hours, major charts for Ethereum were still pointing to just how bearish these instances have been. First of all, the MVRV ratio underlined that ETH, at press time, was in the less profitable zone or the minimally profitable zone. In fact, it was at a level unseen in over 9 months.
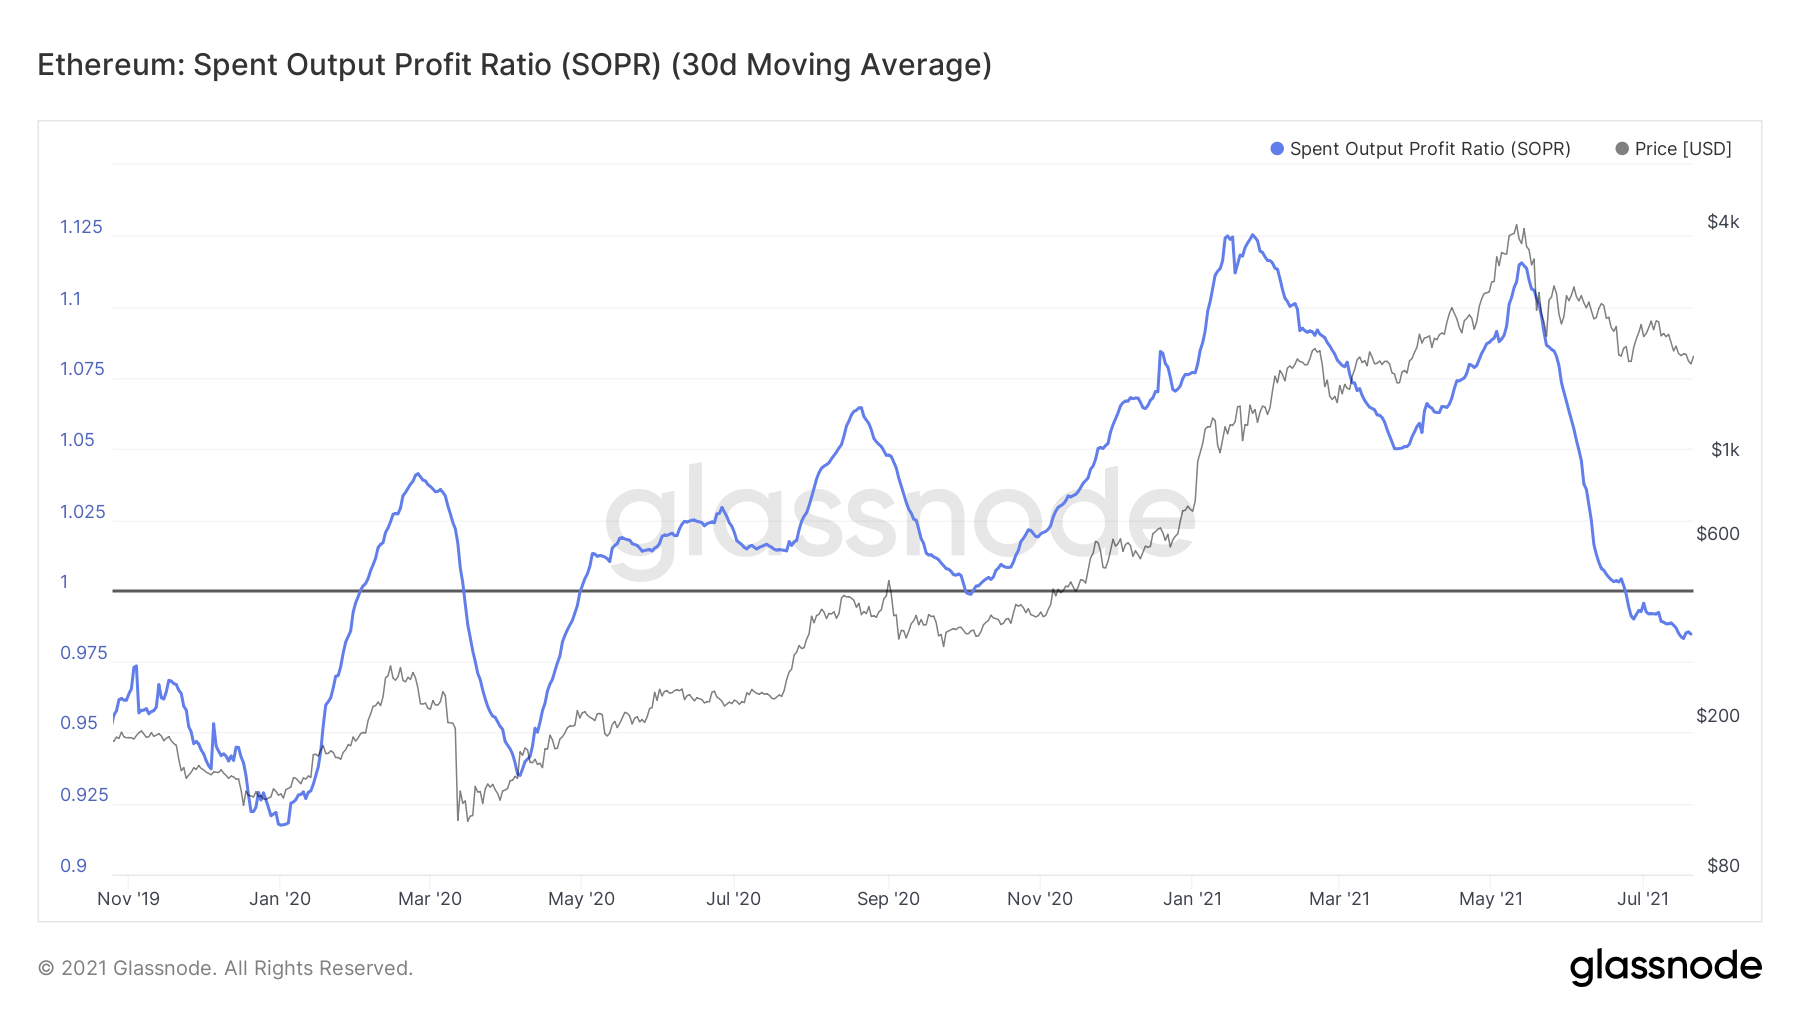
The Spent Output Profit Ratio (SOPR) can be observed too, with the indicator highlighting the value of the coin it was sold at against the value at which it was created. According to the same, ETH is being sold at a loss now. On the 30-day SMA, the ETH market seemed very bearish and added to the possibility of a stronger fall on the charts if the altcoin is unable to sustain its recovery.
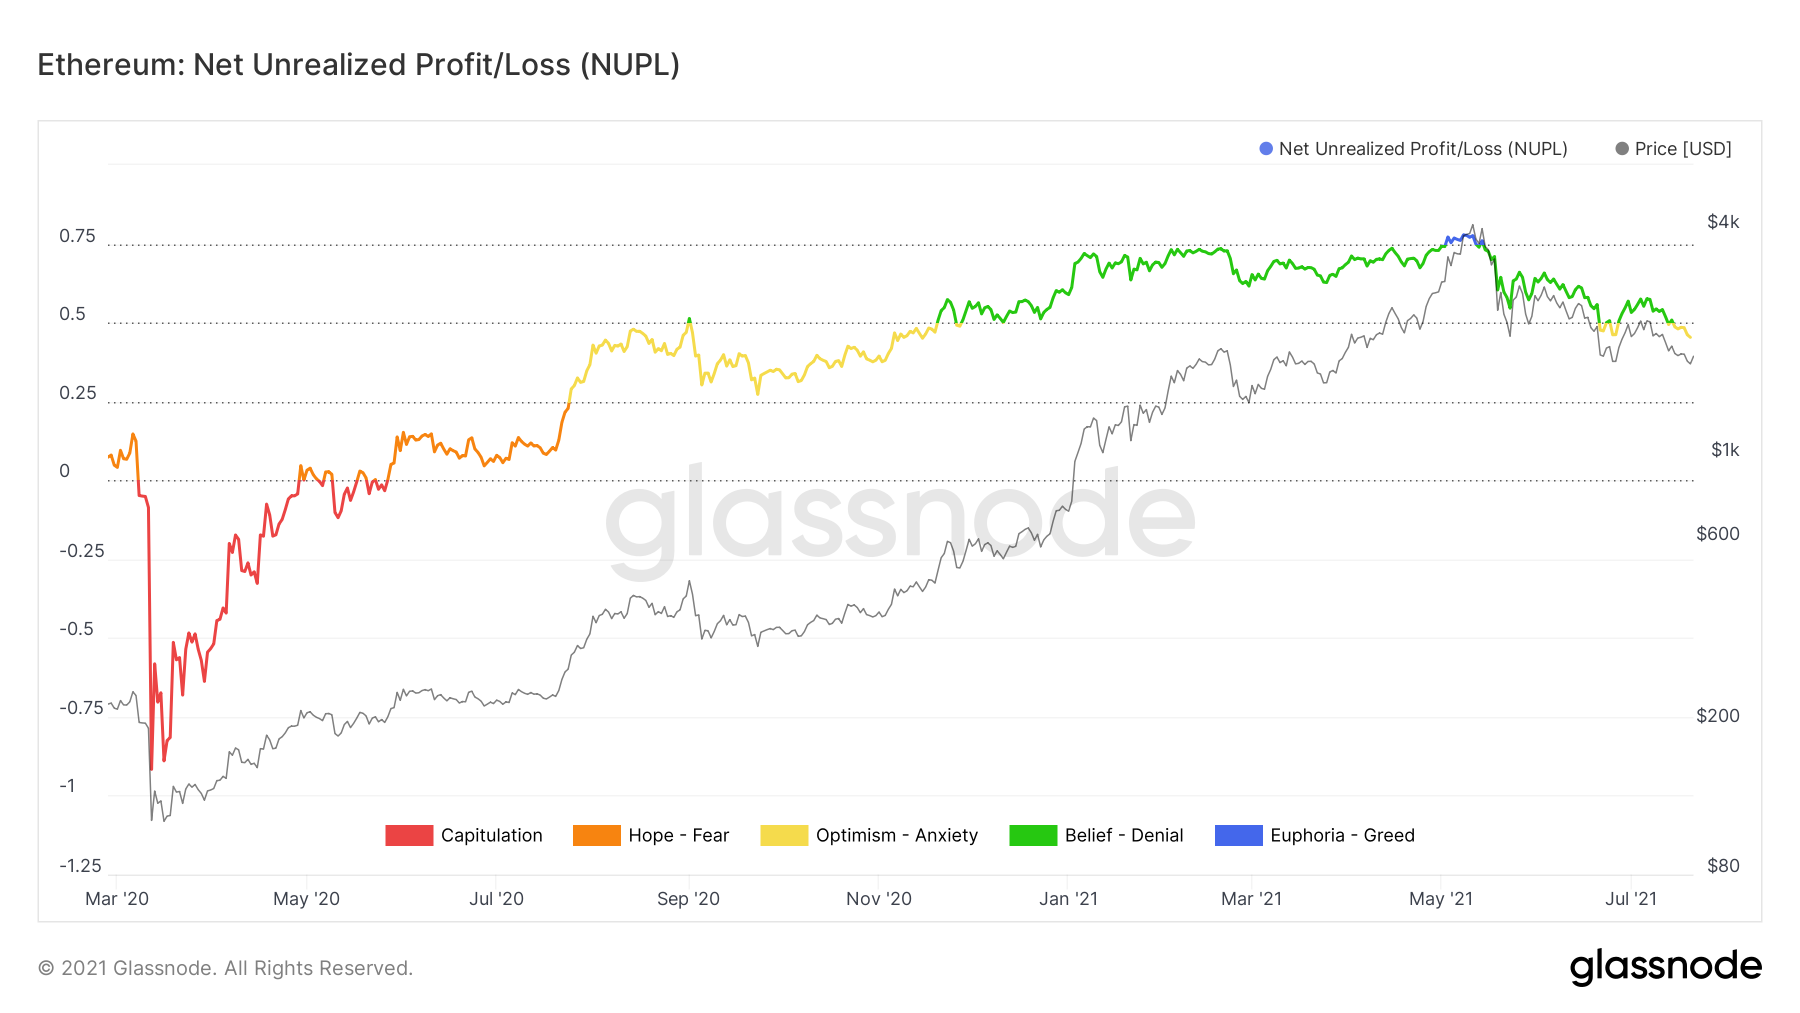
Despite all the bearish cues, however, there was still some hope, as evidenced by the NUPL chart. Even though the indicator was in the yellow zone, it still had bullish and positive cues since it represented an optimistic market sentiment.
Where the coin will go from here is an obvious mystery, but any investment must be made very carefully since the market is not in a position to move sideways.