Ethereum, Dogecoin, Aave Price Analysis: 26 January

As the Bitcoin fear and greed index saw an 11 point surge, the crypto market entered a green zone in the last 24 hours. Ether saw a nearly 4% 24-hour gain that helped it cross the 20-SMA barrier.
After Elon’s tweet, Dogecoin jumped to reclaim the $0.145-mark. Also, Aave’s 4-hour RSI saw a patterned breakout but still could not cross the midline. However, to have a sustainable rally, the bulls still had to gather enough volumes.
Ether (ETH)
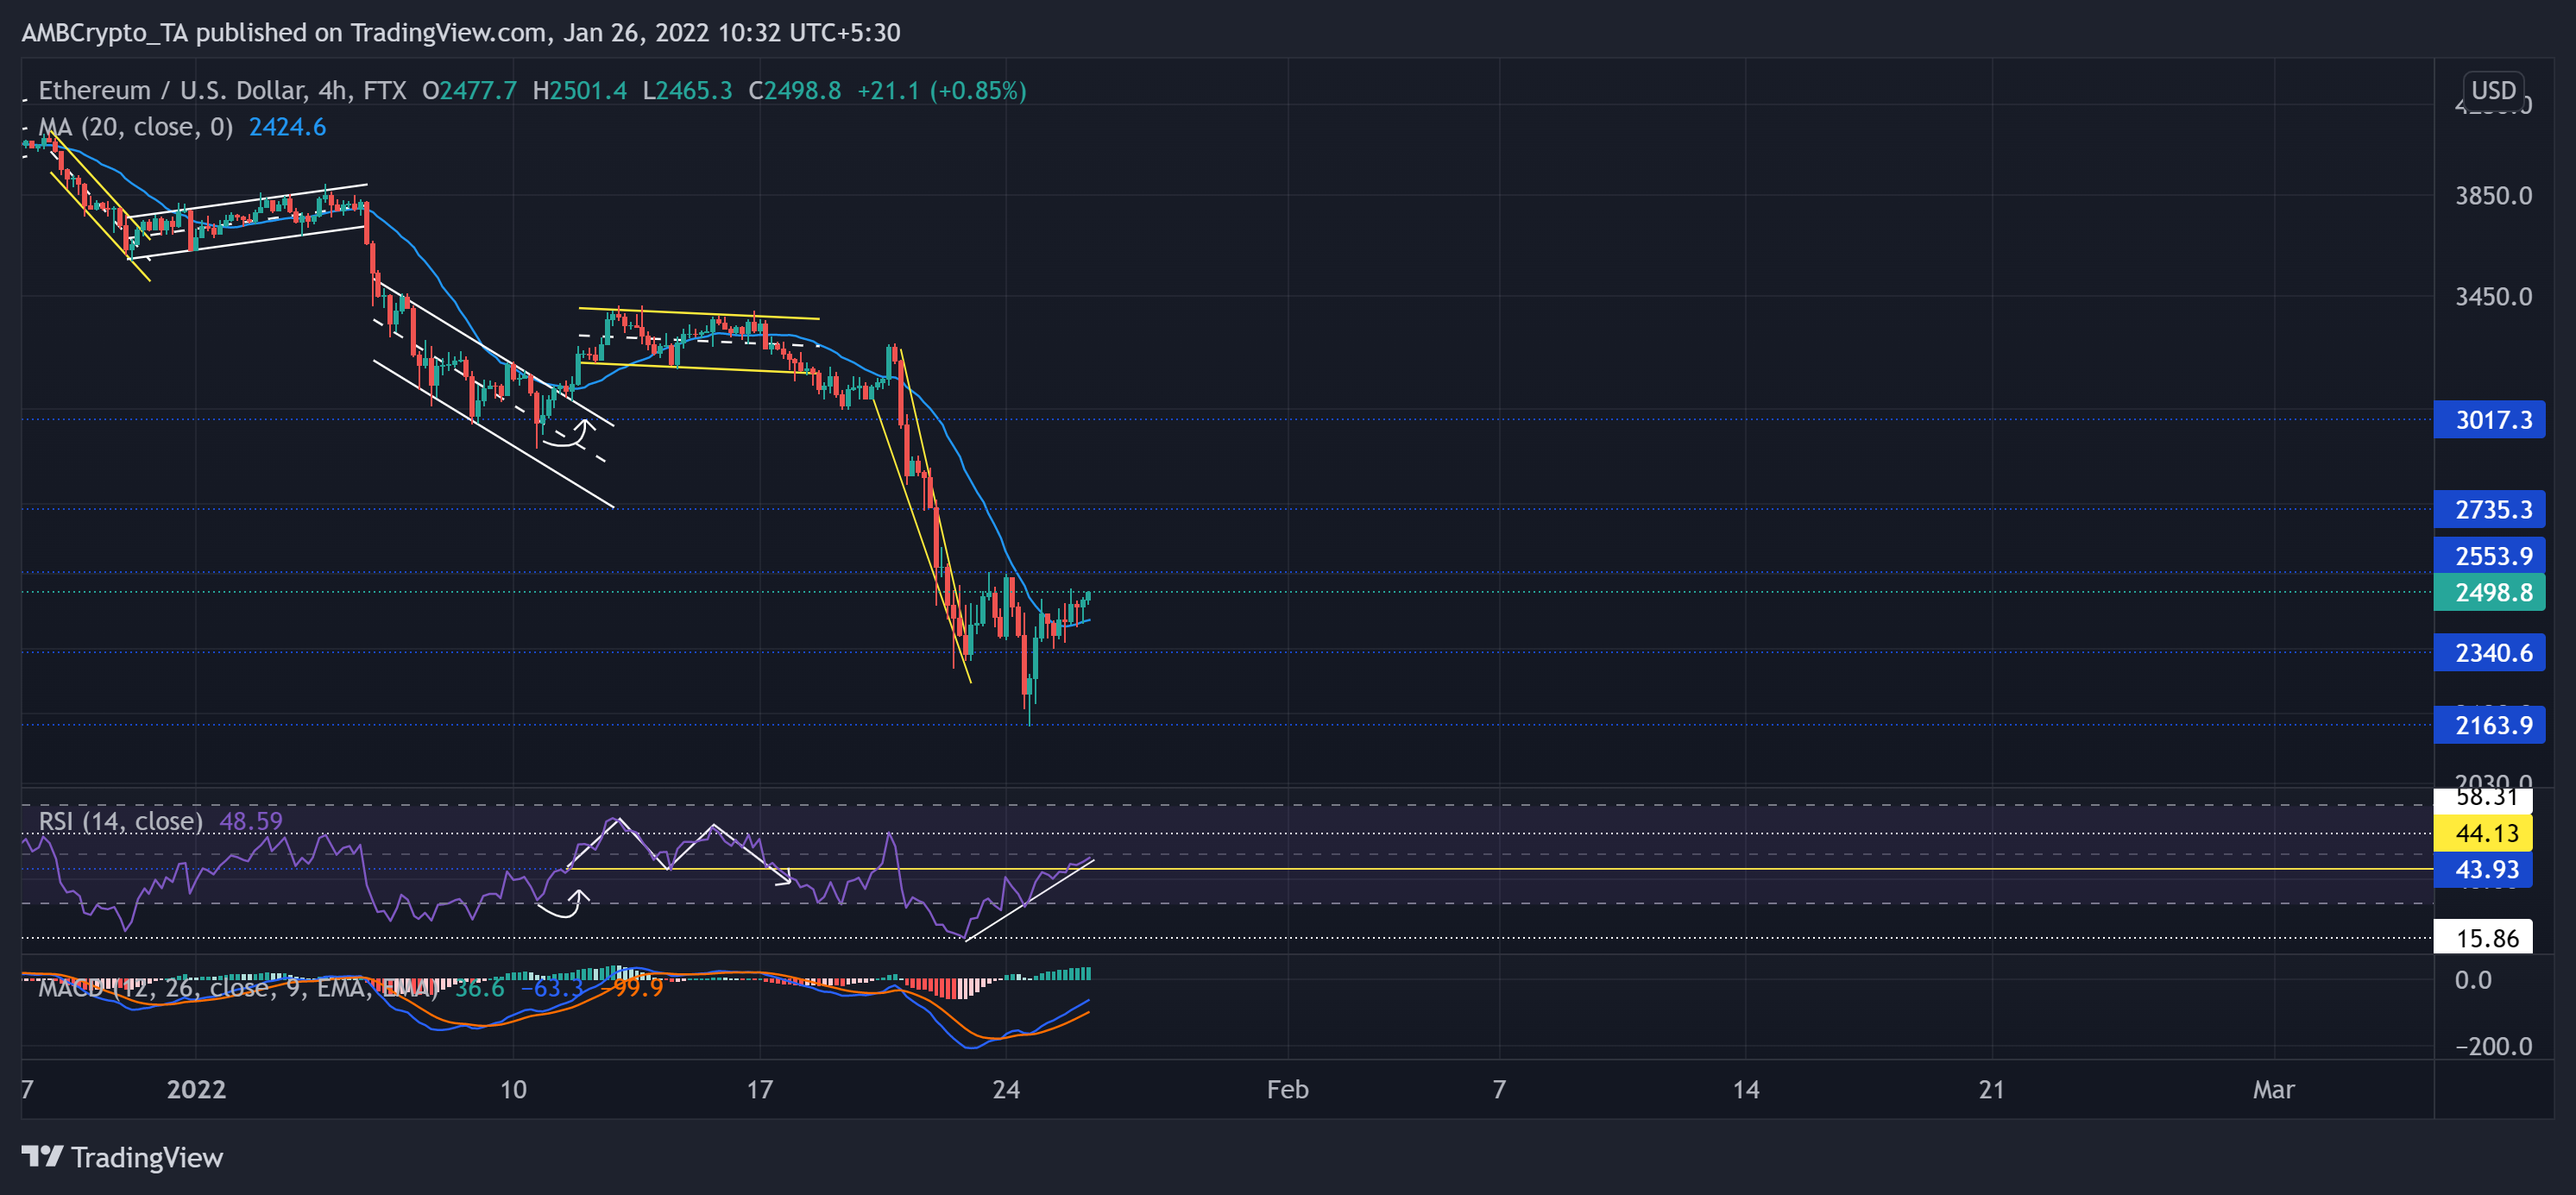
While the fear sentiment in the market kept spiraling, the sellers accelerated their influence and caused a fallout on 21 January. As a result, they swiftly breached the $3000-mark and flipped it to resistance. ETH registered a 33.84% loss (from 20 January high) and touched its six-month low on 24 January.
The recent falling wedge (yellow) breakout halted at the $2,550-mark (immediate resistance). Since then, ETH bulls tested the 20-SMA (cyan) two times over the past day and finally surpassed it.
At press time, ETH was trading at $2,498.8. Following the broader sell-off, the RSI saw an impressive revival 32 point revival from its 22-month low (on 22 January). Thus, it found a close above the crucial 44-mark. But to confirm the buying momentum, it needed to close above the half-line. Also, MACD‘s histogram found a close above the equilibrium. This reading hinted at the decreasing bear influence.
Dogecoin (DOGE)
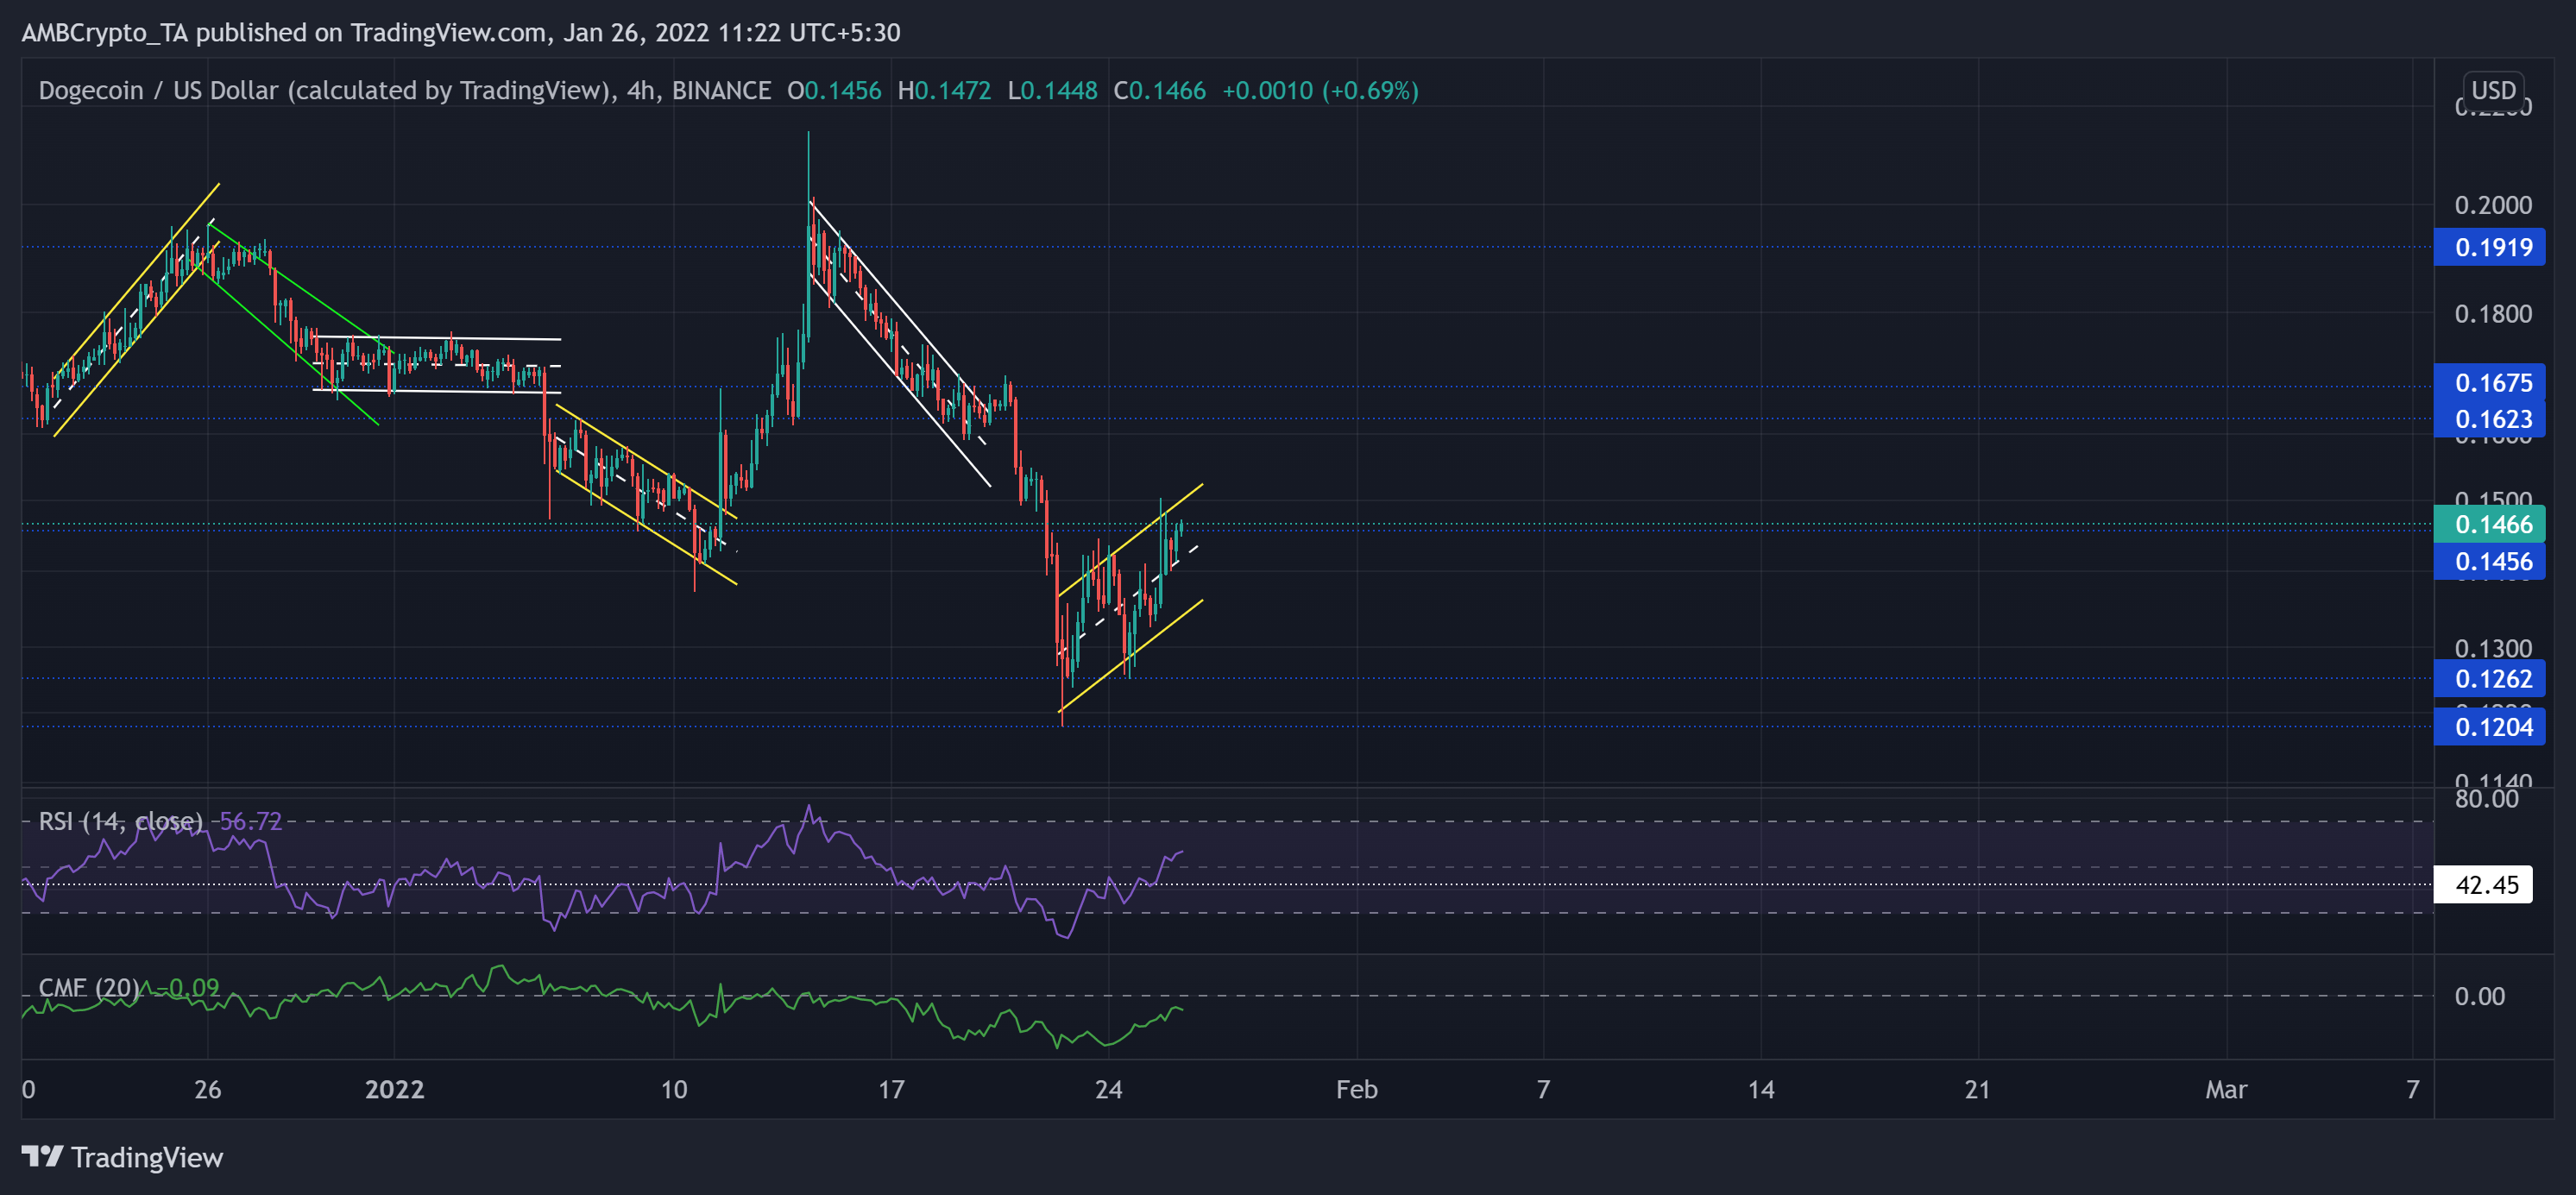
DOGE saw an exceptional 55.94% ROI (from 10 January low) and touched its month-long high on 14 January. Since then, the sellers stepped in at $0.1919-mark. As a result, the altcoin saw a 41.18% retracement and hit its nine-month low on 22 January.
As the bulls defended the $0.1262-level, DOGE saw an over 15% gain (since 22 January low) and reclaimed the $0.1456-support. Now, the immediate resistance stood at the upper trendline of the up-channel (yellow).
At press time, DOGE was trading at $0.1466 after noting an 8.49% 24-hour gain. The RSI finally jumped above the 42-mark level, followed by the equilibrium. This trajectory entailed a bullish bias. However, the CMF was yet to find a close above the zero line while it flashed weak signs.
AAVE
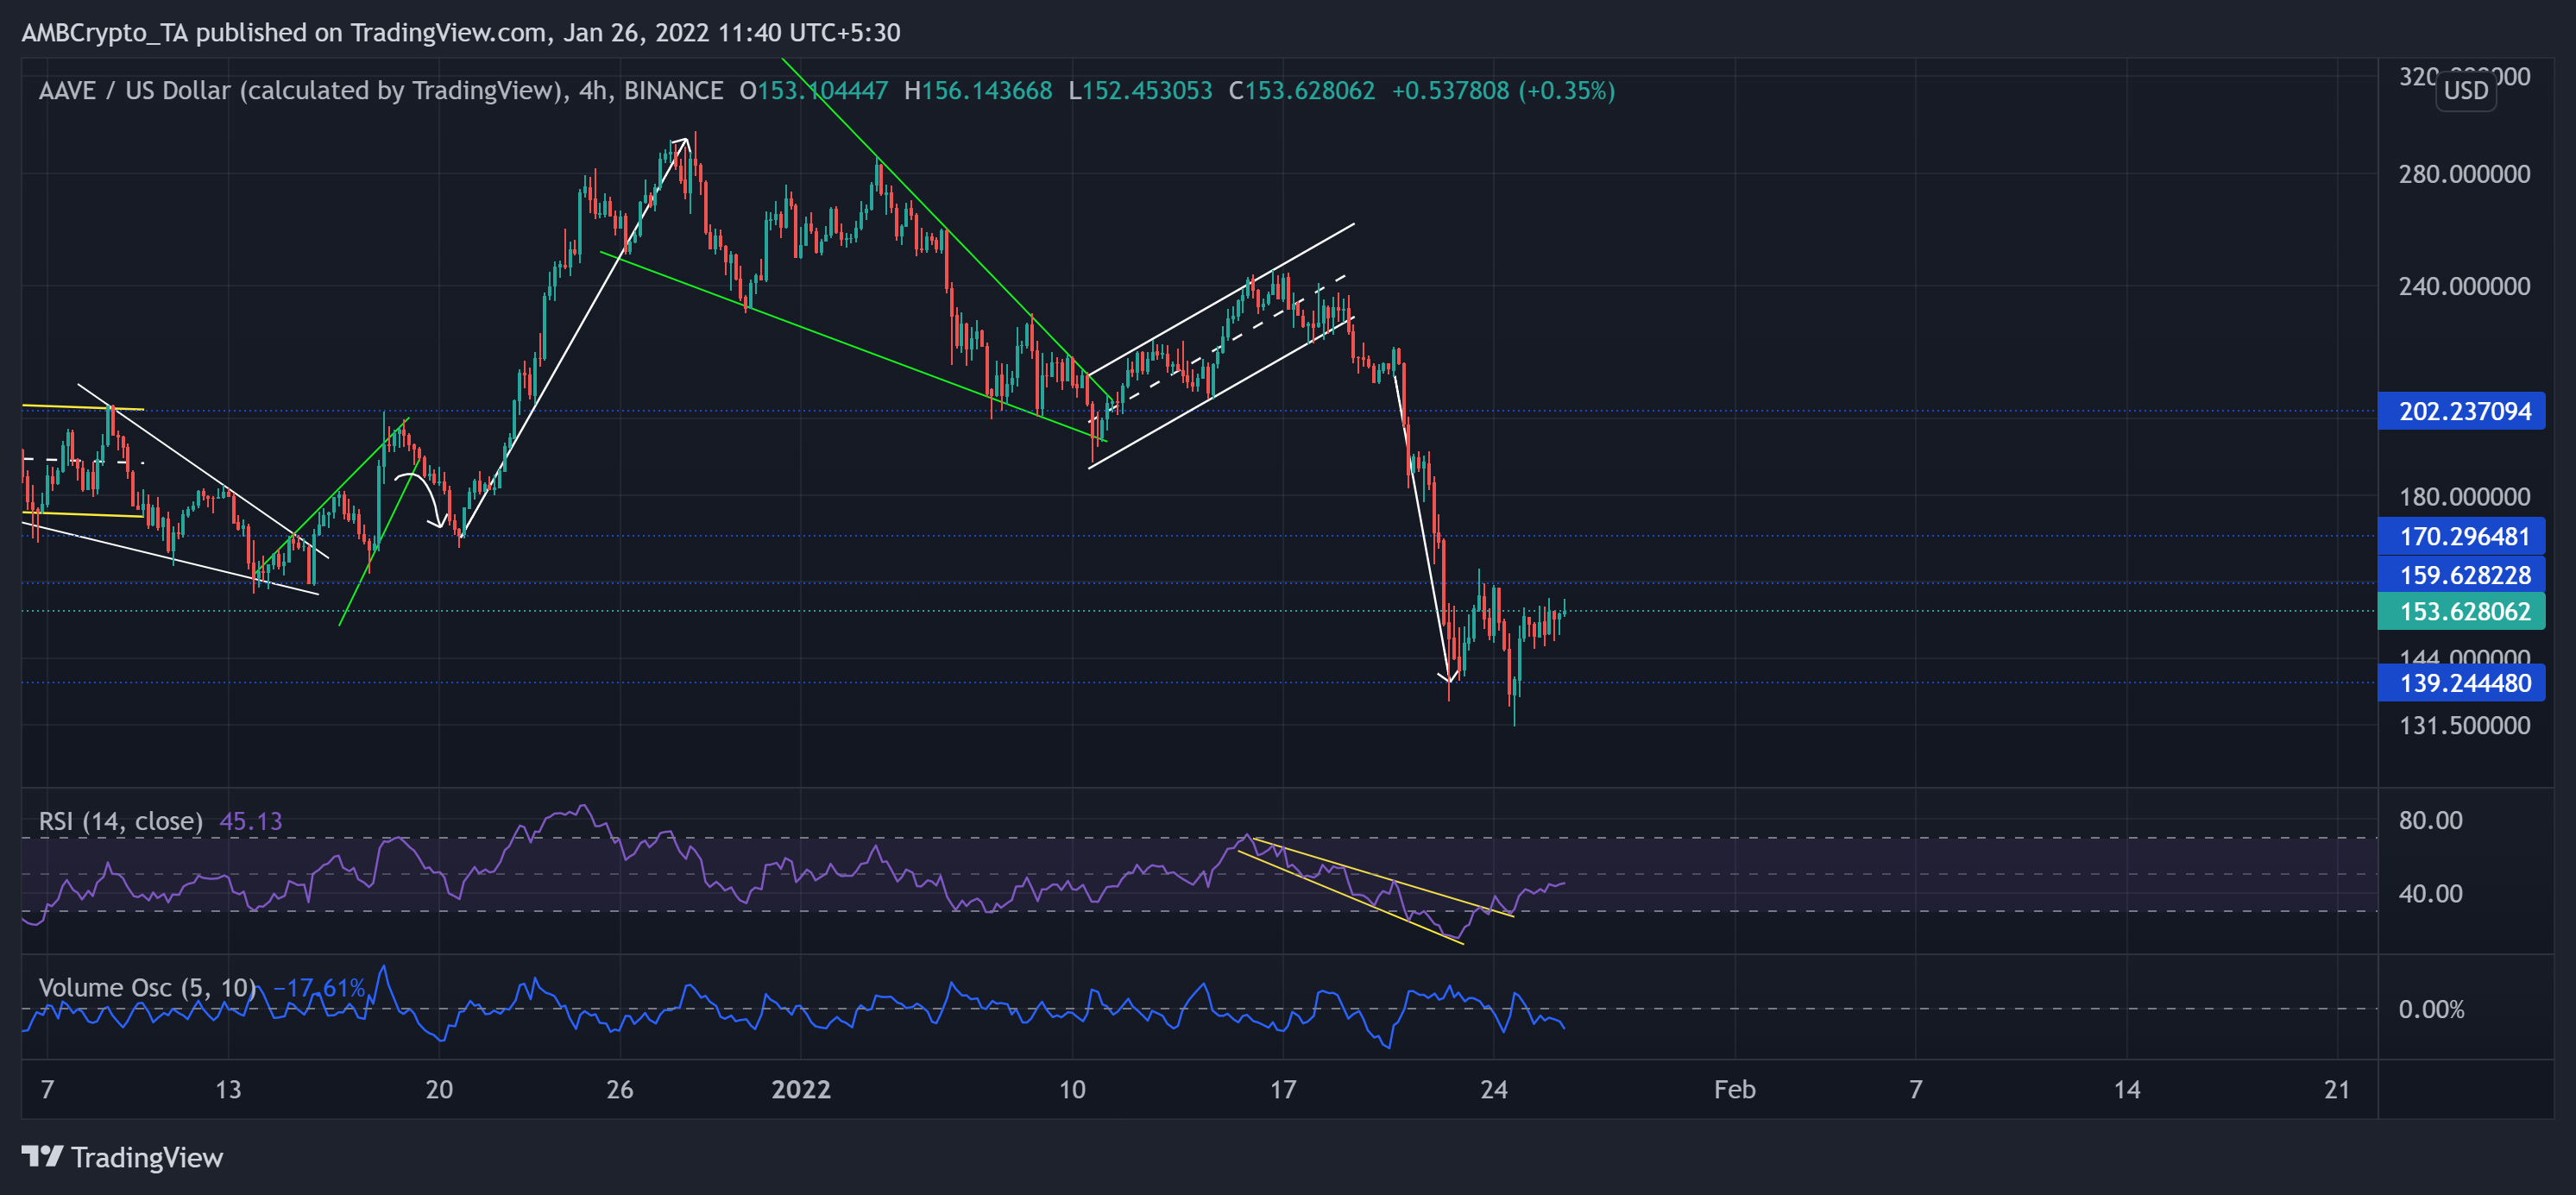
The alt saw a falling wedge (green) after reaching its six-week high on 28 December. The subsequent breakout resulted in an up-channel (white). Since then, the sellers took over as bulls lost their edge after the up-channel breakdown.
AAVE lost over 45.95% (from 16 January) of its value until it poked its year-long low on 24 January. Now, the $159-mark stood as a sturdy hurdle for the bulls.
At press time, AAVE was trading at $153.628. The RSI saw a descending broadening wedge breakout displayed a strong recovery. Yet, AAVE’s Volume Oscillator depicted weak signs after plunging below the half-line.


