Ethereum, Dogecoin, FTX Token Price Analysis: 29 August

Bitcoin and Ethereum reversed their gains slightly over the last 24 hours. The same pattern was reflected for the movement of most altcoins. Dogecoin dropped by 2.2% and prepared to move closer to its $0.273 price floor. FTX Token started to trade beneath its $49.24 support level owing to the 2% dip since yesterday.
Ethereum (ETH)
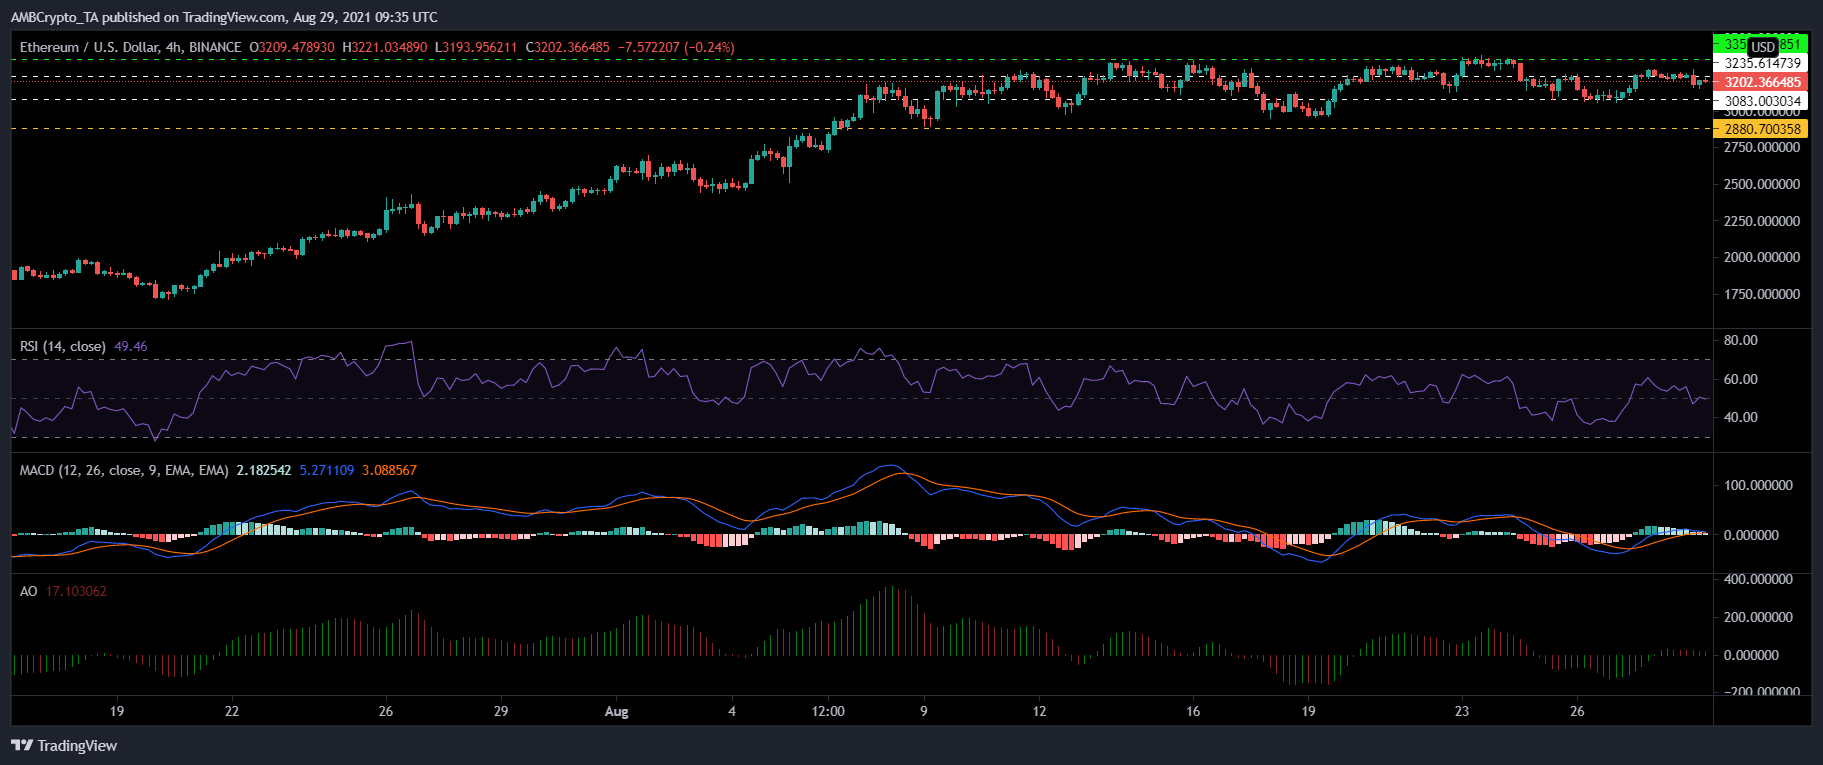
Ethereum was down by 0.9% and was trading at $3,208.36. The alt-king was trading right below the $3235.61 support level and a dip from the current price level would push prices down to the $3083 price floor. .
Buying strength fell as Relative Strength Index stood slightly beneath the 50-mark. MACD’s green bars on the histogram were receding over the past trading sessions.
Lastly, Awesome Oscillator noted small red signal bars indicating a weakening of the recent recovery. If ETH reverses its prices, the first resistance was at $3235.61 and then at $3350.87 respectively.
Dogecoin (DOGE)
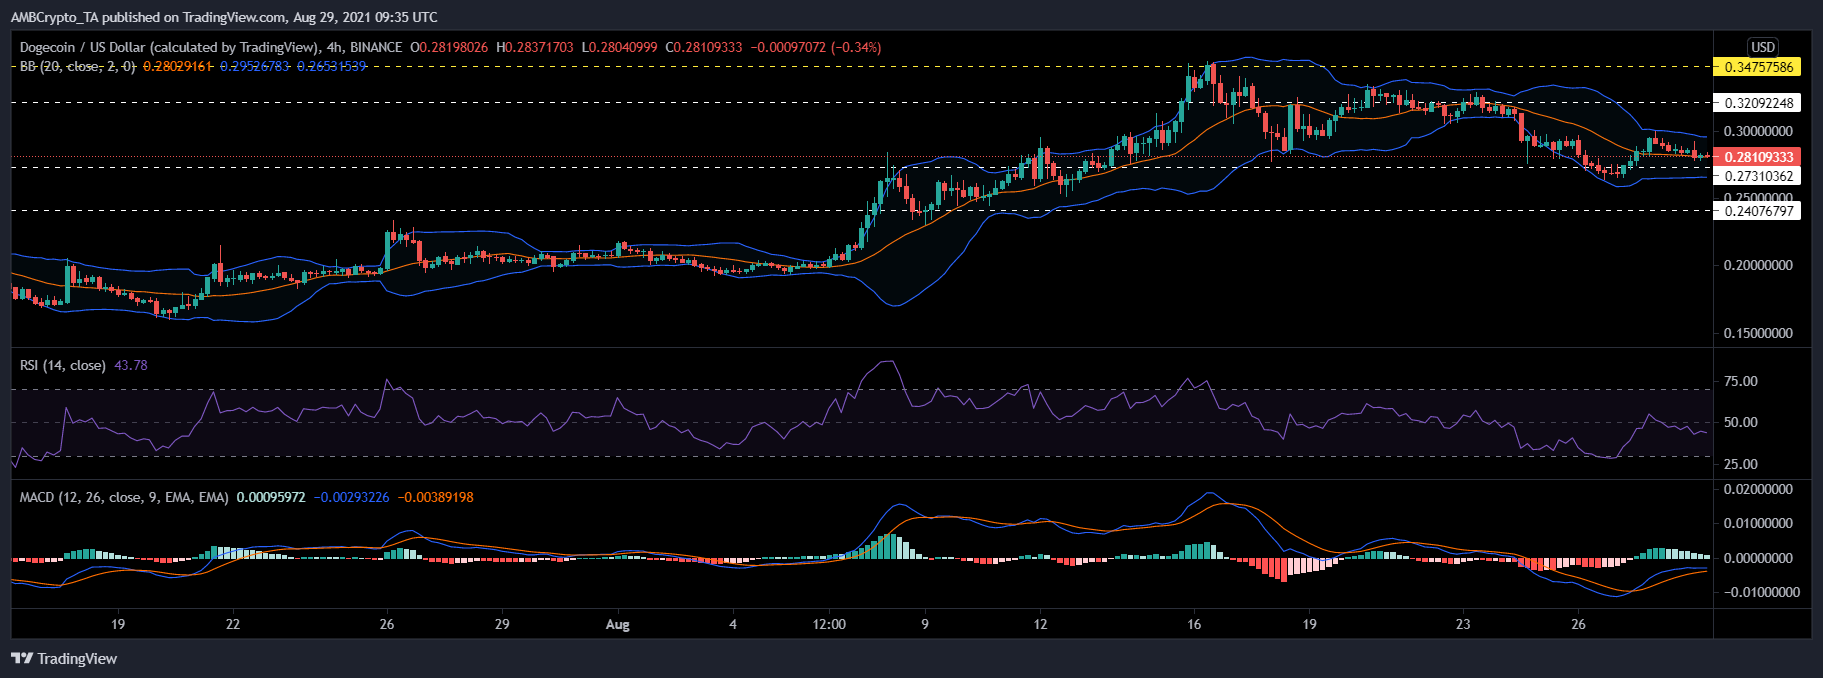
Dogecoin declined by 2.2% over the last 24 hours and was priced at $0.281. The token eyed its immediate support level of $0.273 and with a continued downward move the coin could rest on $0.240. As per the indicators, bullish strength had fizzled out from the market.
Profit-taking dragged the Relative Strength Index below the mid-line. Green bars on the MACD histogram declined over the past trading sessions.
Bollinger Bands pointed at constricted and range bound movement with the tightening of the bands. The expected range to trade within, was between $0.300 and $0.273. On the flip side, if DOGE recovers, it would witness resistance at $0.320 and then at $0.347.
FTX Token (FTT)
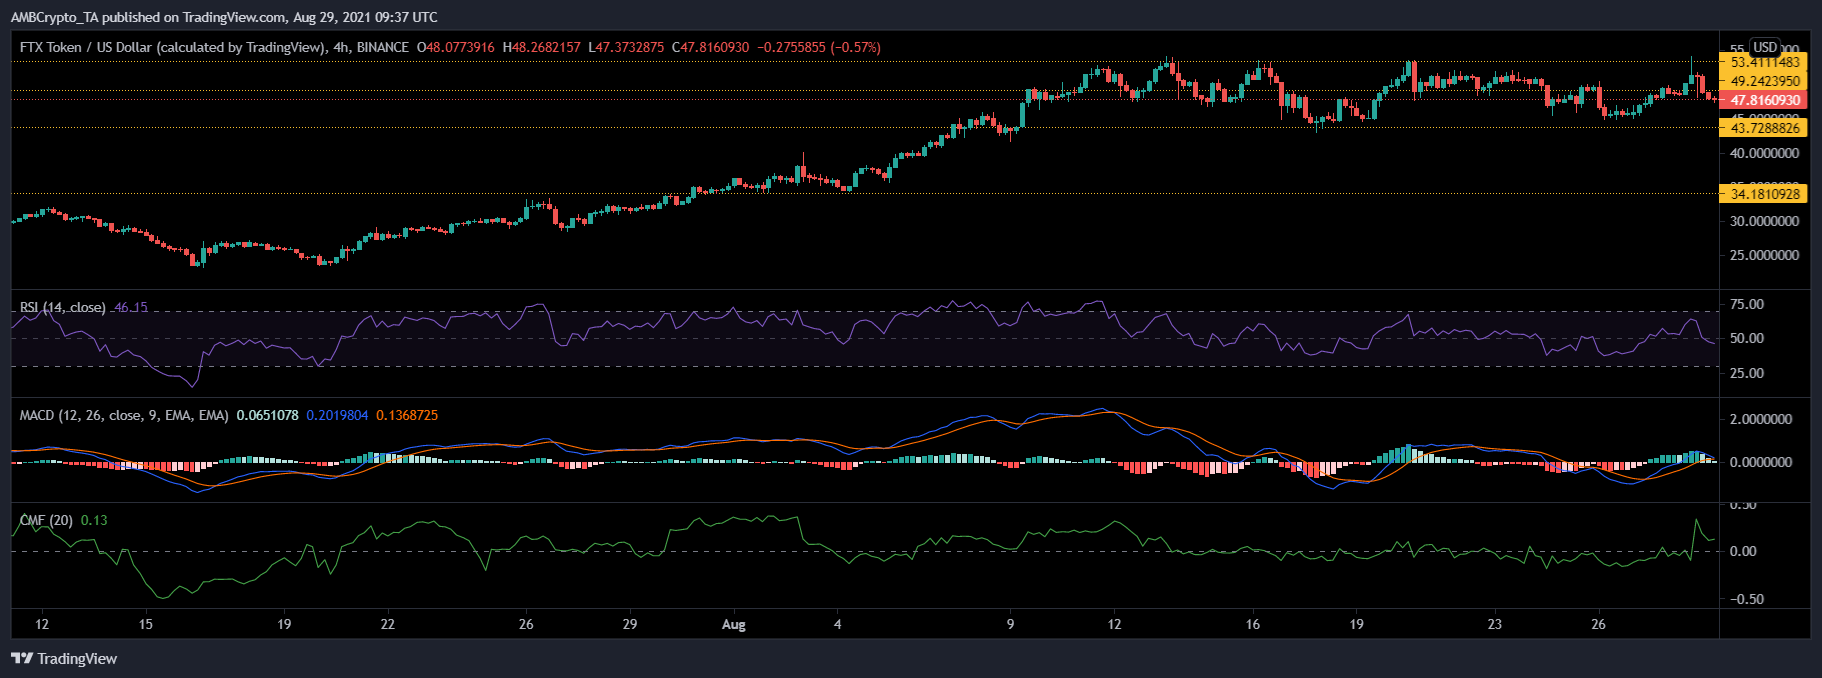
FTT was trading at $47.81 after declining by 2% over the last day. The coin broke below the $49.24 support line just 24 hours ago. In case of a downward push, additional support lines stood at $43.72 and $34.18. FTT’s bullish momentum seemed to have halted as reflected on the parameters.
Buying strength fell, as Relative Strength Index stood below the 50-mark. MACD flashed smaller green bars on the histogram, as bullish strength receded over the last trading sessions.
Conversely, Chaikin Money Flow stayed above the half-line, inside the bullish territory as capital inflows exceeded outflows. If FTT manages to topple over the $49.24 resistance mark and trade above it for longer than just a few sessions, it could retest the $53.41 price ceiling.