Ethereum, Dogecoin, Solana Price Analysis: 3 November

Mixed trading signals were observed across the crypto market today. Some altcoins like Ethereum and Solana reached their ATH as their prices climbed up the charts and witnessed double-digit growth in the past week.
Nevertheless, near-term technicals for the aforementioned cryptos hint at decreasing buying pressure. On the other hand, some alts like Dogecoin registered a 2.6% decline in the past 24 hours.
Ethereum (ETH)
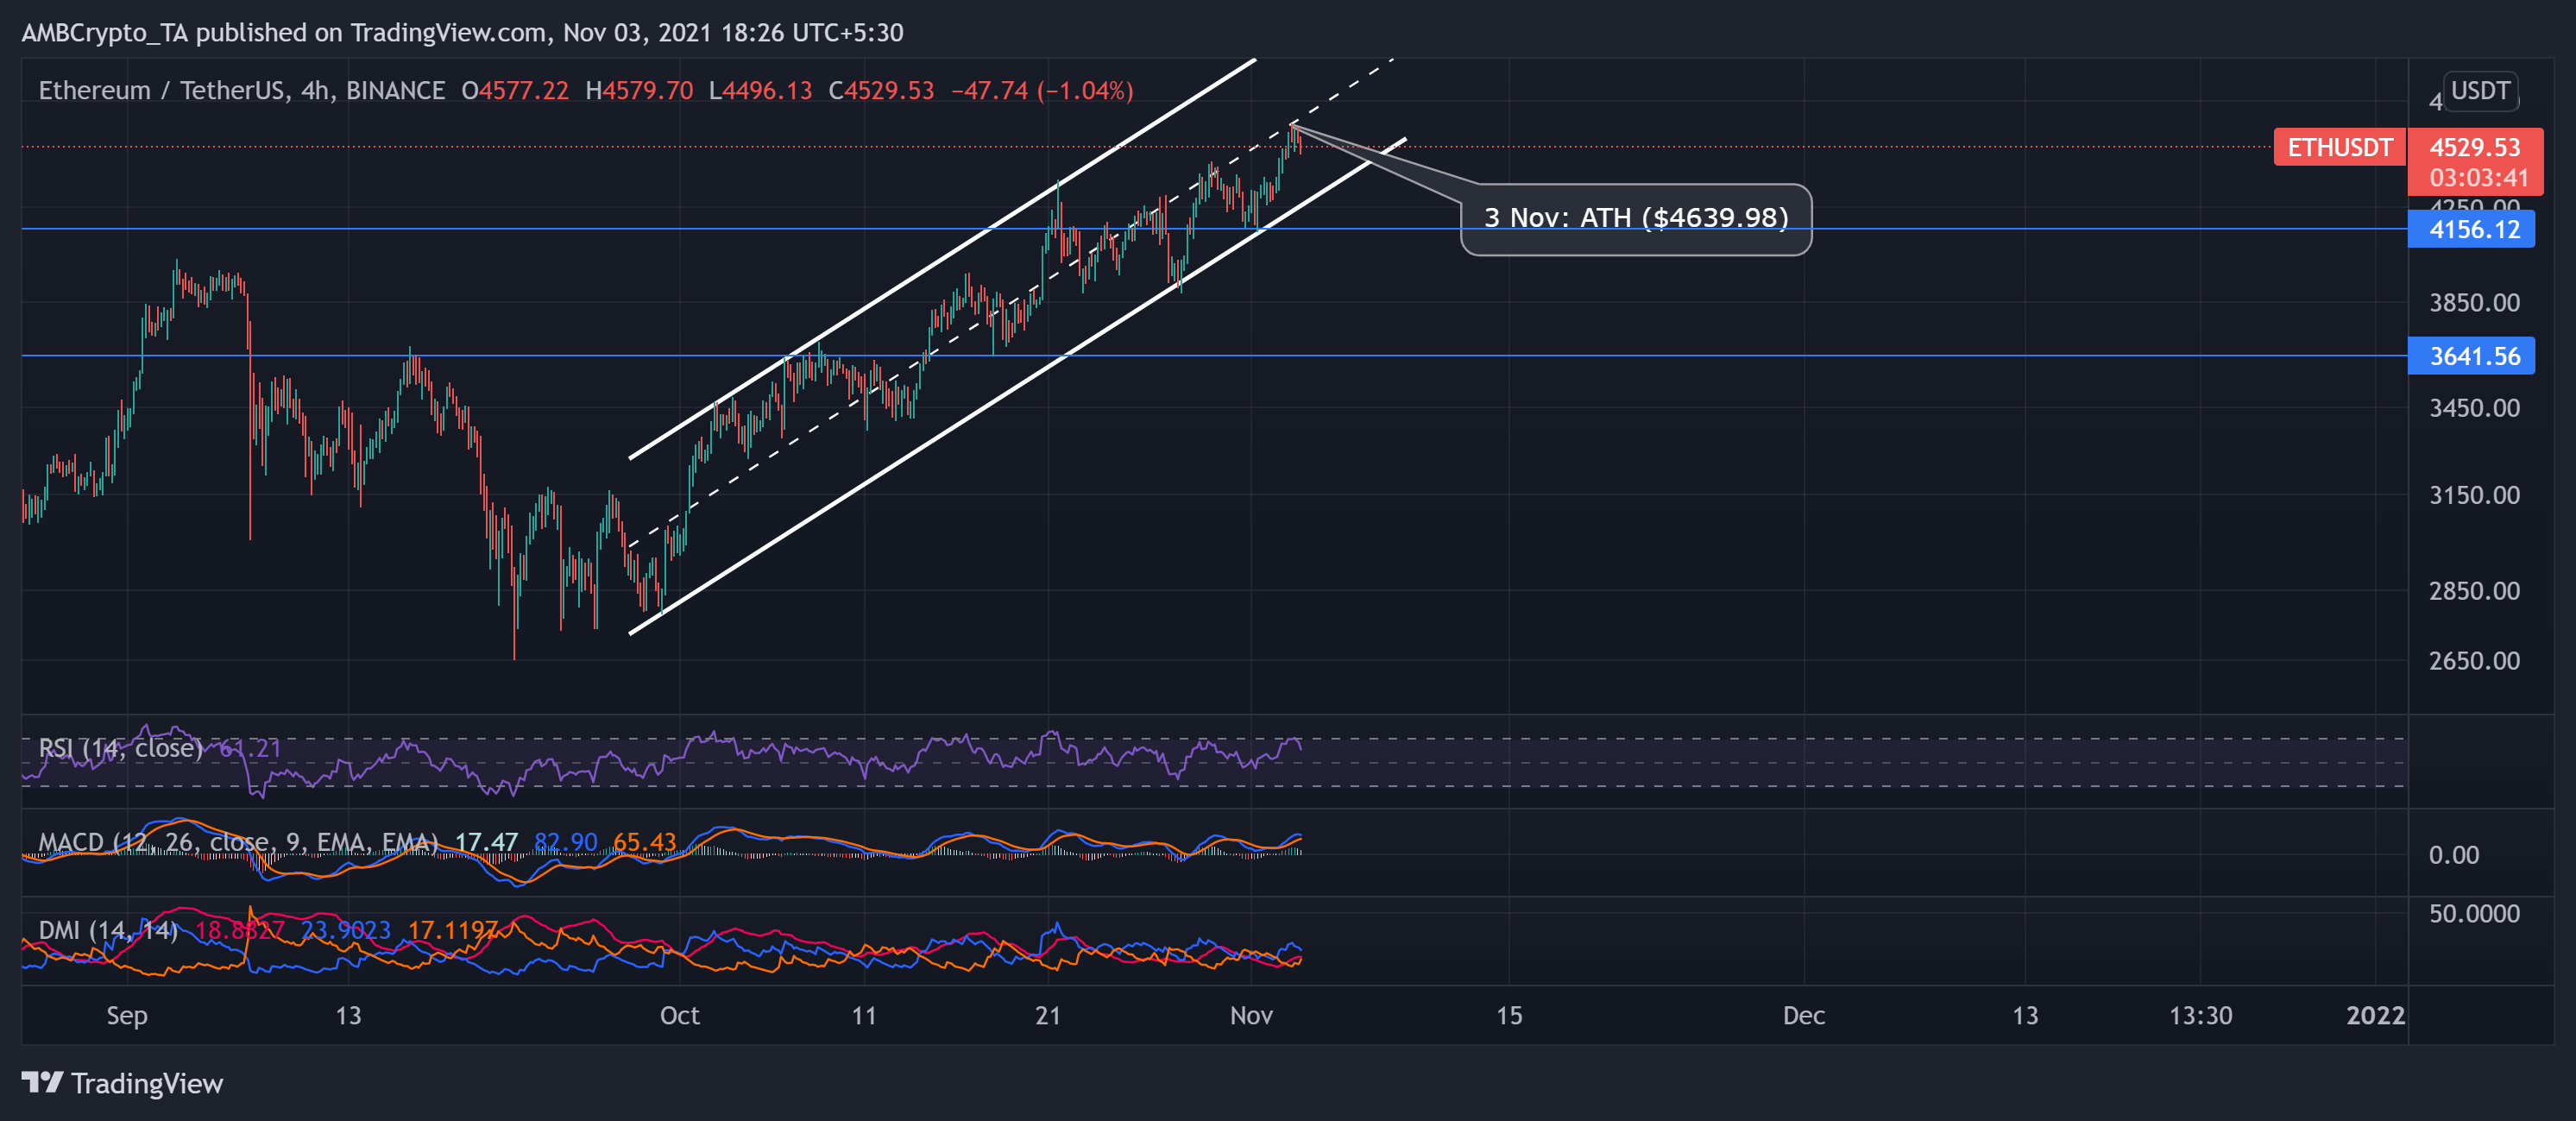
ETH price rallied by over 16% in the past week and traded at $4529.53 at press time. Since 28 September, Ether oscillated in an uptrend between parallel channels and registered a 35.22% monthly ROI. As a result, the largest altcoin reached its ATH price on 3 November at $4,639.98.
Over the past 21 days, ETH bulls exerted immense pressure as they ruptured multiple support lines while the bears looked at $4,156.12 for immediate support. Near-term technicals obliged the uptrend and displayed a preference for buyers. They also hint at possible ease in bullish momentum.
The Relative Strength Index (RSI) plunged from the overbought territory and seemed to head south toward the midline. Also, the MACD histogram flashed shorter light green bars, hinting at a decreasing buying pressure.
Moreover, DMI lines showed a preference for buyers but seemed on the verge of a bearish divergence. Nevertheless, the ADX line stood at the 18-mark, depicting a weak directional trend.
Dogecoin (DOGE)
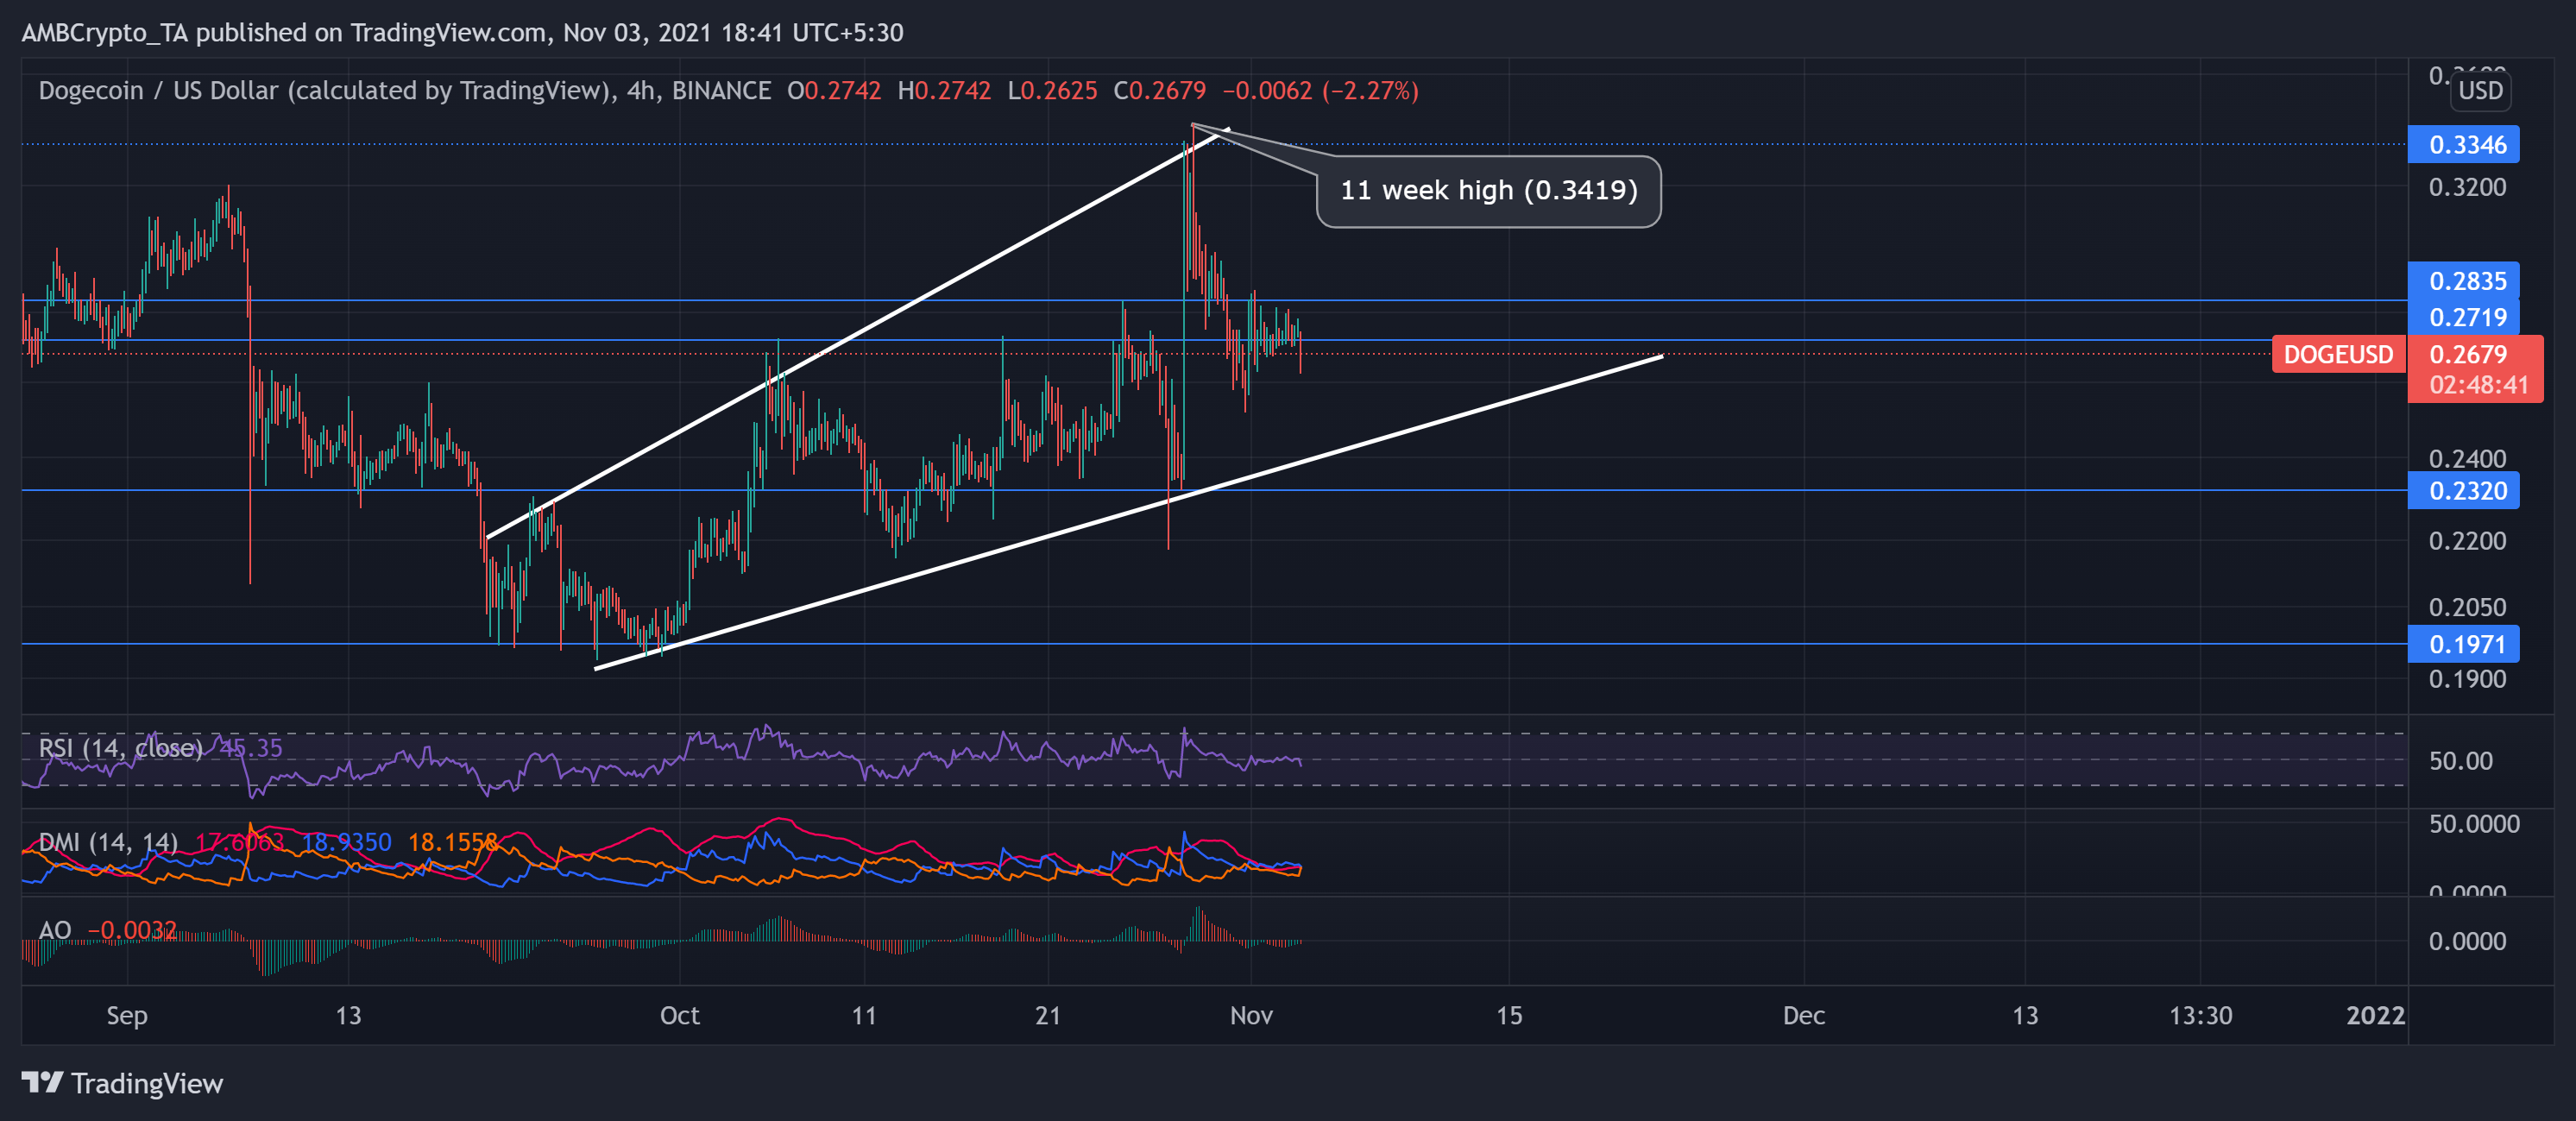
Since 26 September, the DOGE price action moved within a rising wedge pattern. The digital currency noted over 11% monthly ROI.
Consequently, the alt touched its 11-week high on 28 October and bounced back from the upper trendline. However, DOGE saw a 2.6% decline in 24 hours as near-term technicals depicted decreasing buying pressure. At press time, DOGE traded at $0.2679.
The RSI was near the midline and depicted a downtrend. Also, the Awesome Oscillator (AO) exhibited an inclination for the sellers. Additionally, the DMI lines were on the verge of a bearish crossover. However, the ADX line depicted a weak directional trend.
Solana (SOL)
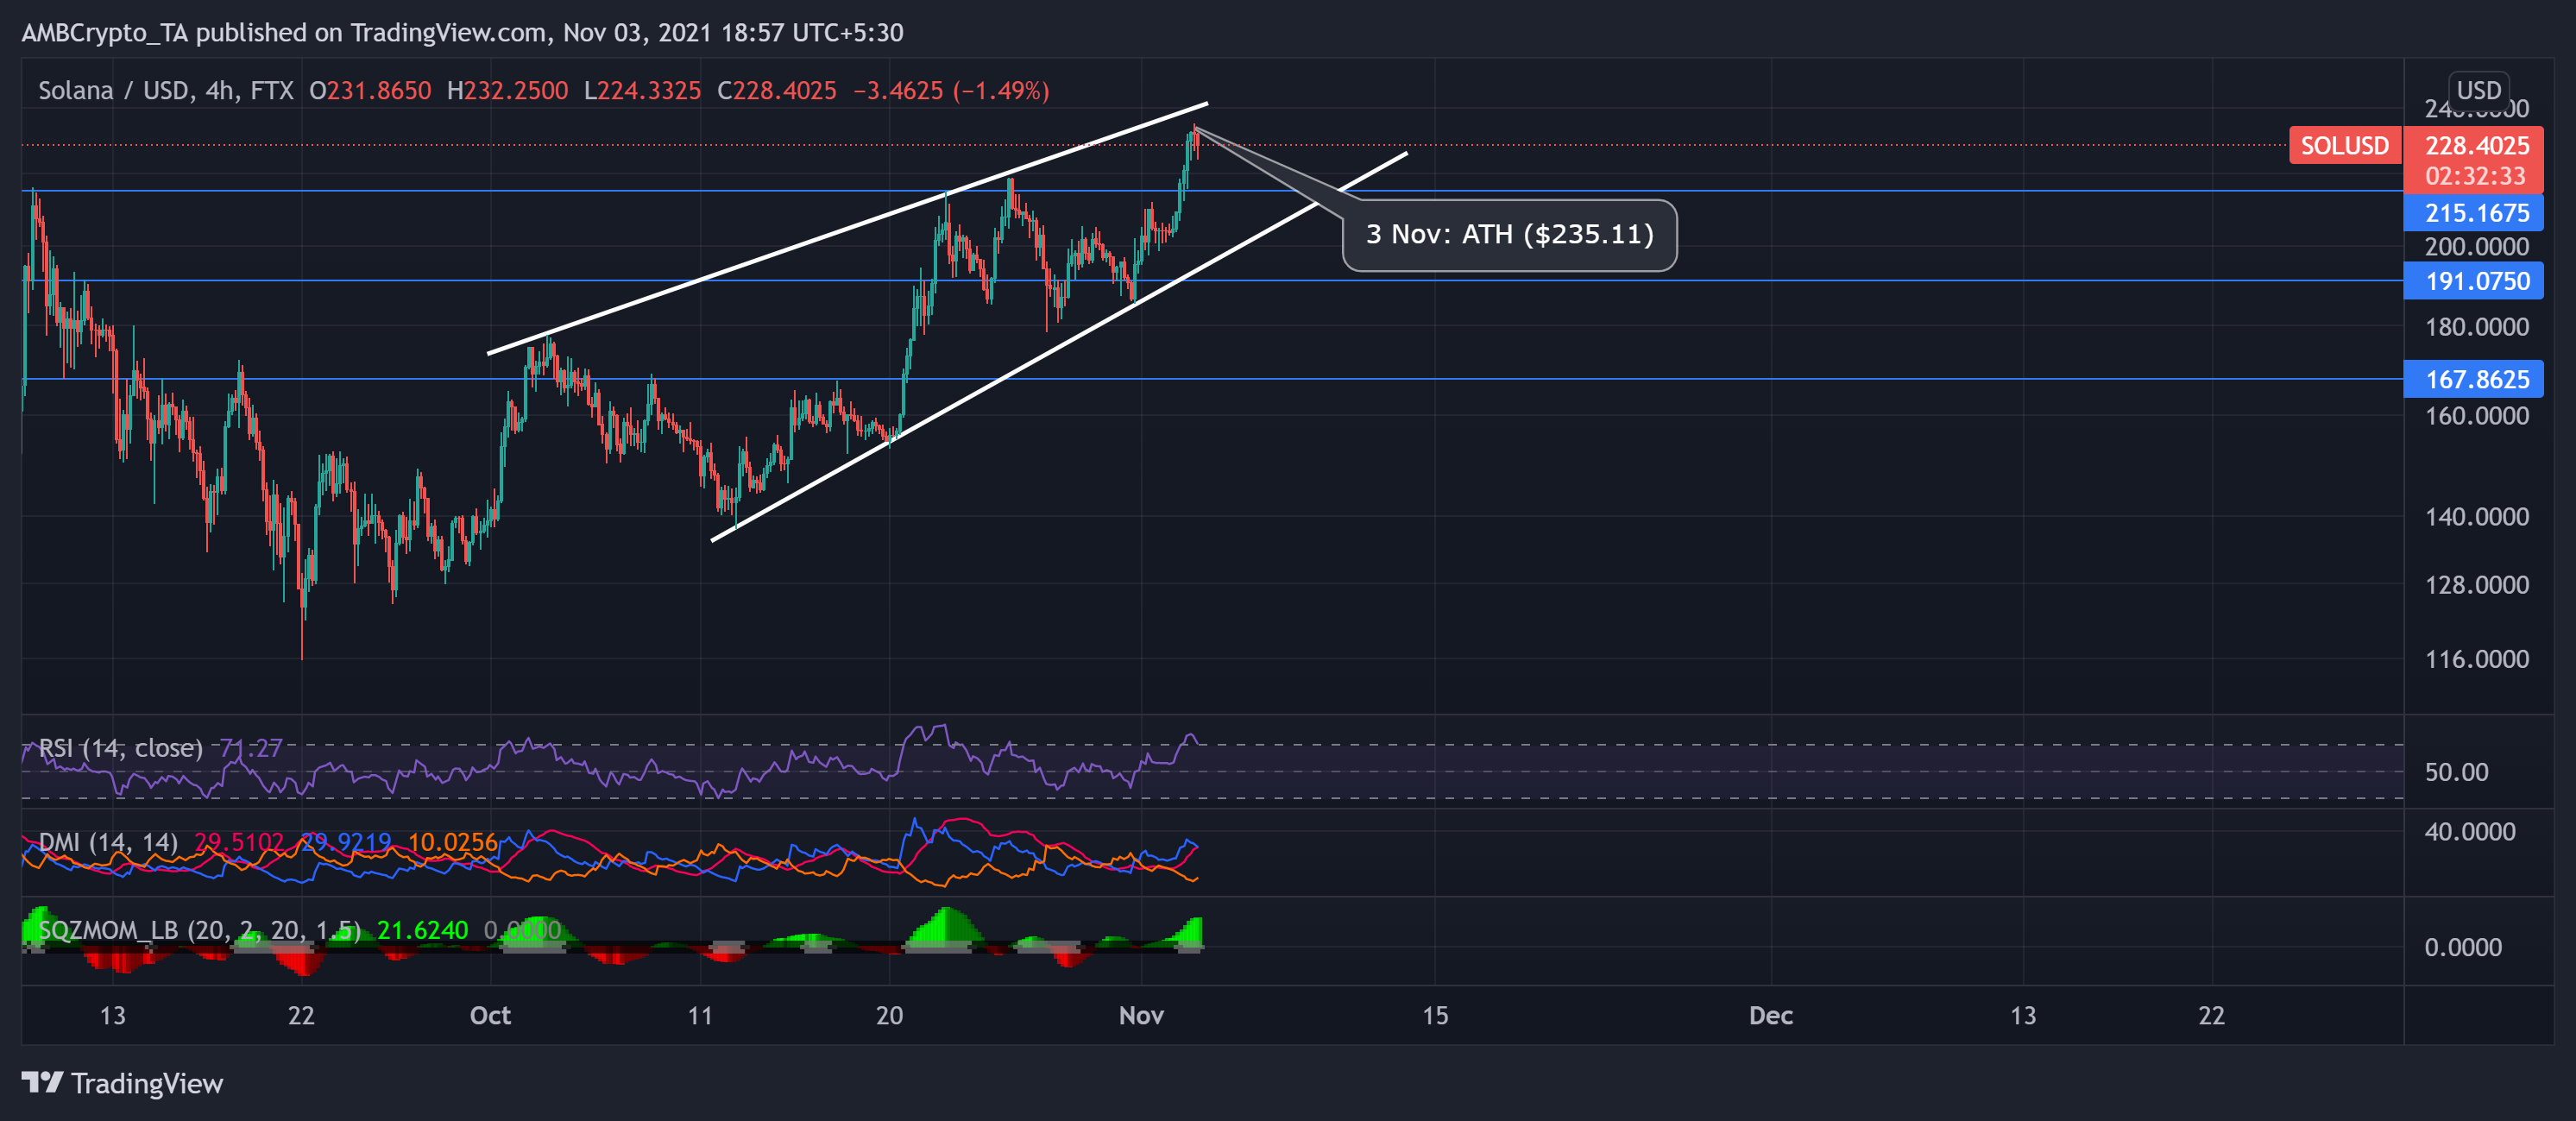
SOL has projected a bullish momentum since the past month as it registered a 36.64% gain on monthly charts. The crypto’s price oscillated in an uptrend marking higher highs and hit its ATH on 3 November at $235.11. Then, it plunged towards the lower trendline and found support at $215.1675.
At press time, the digital currency traded at $228.4025. Key technicals point towards possible ease in bullish momentum in the near term.
The RSI stood in the overbought territory and looked south. Additionally, DMI indicated a preference for buyers, but the +DI line was in a downtrend. However, the Squeeze Momentum Indicator displayed grey dots and suggested a momentum phase with a possible high volatility.


