Ethereum, EOS, VeChain Price Analysis: 21 December

Bitcoin’s price was pushed to the $45.7 area in a search for liquidity once more, and it has found buyers over the past few hours and was trading at $48.6 at press time. Altcoins reacted favorably to BTC’s bounce. Ethereum was trading above the $4000 mark once more, while EOS broke past a trendline resistance from a month earlier. VeChain also posted gains of around 5% since yesterday’s lows.
Ethereum [ETH]
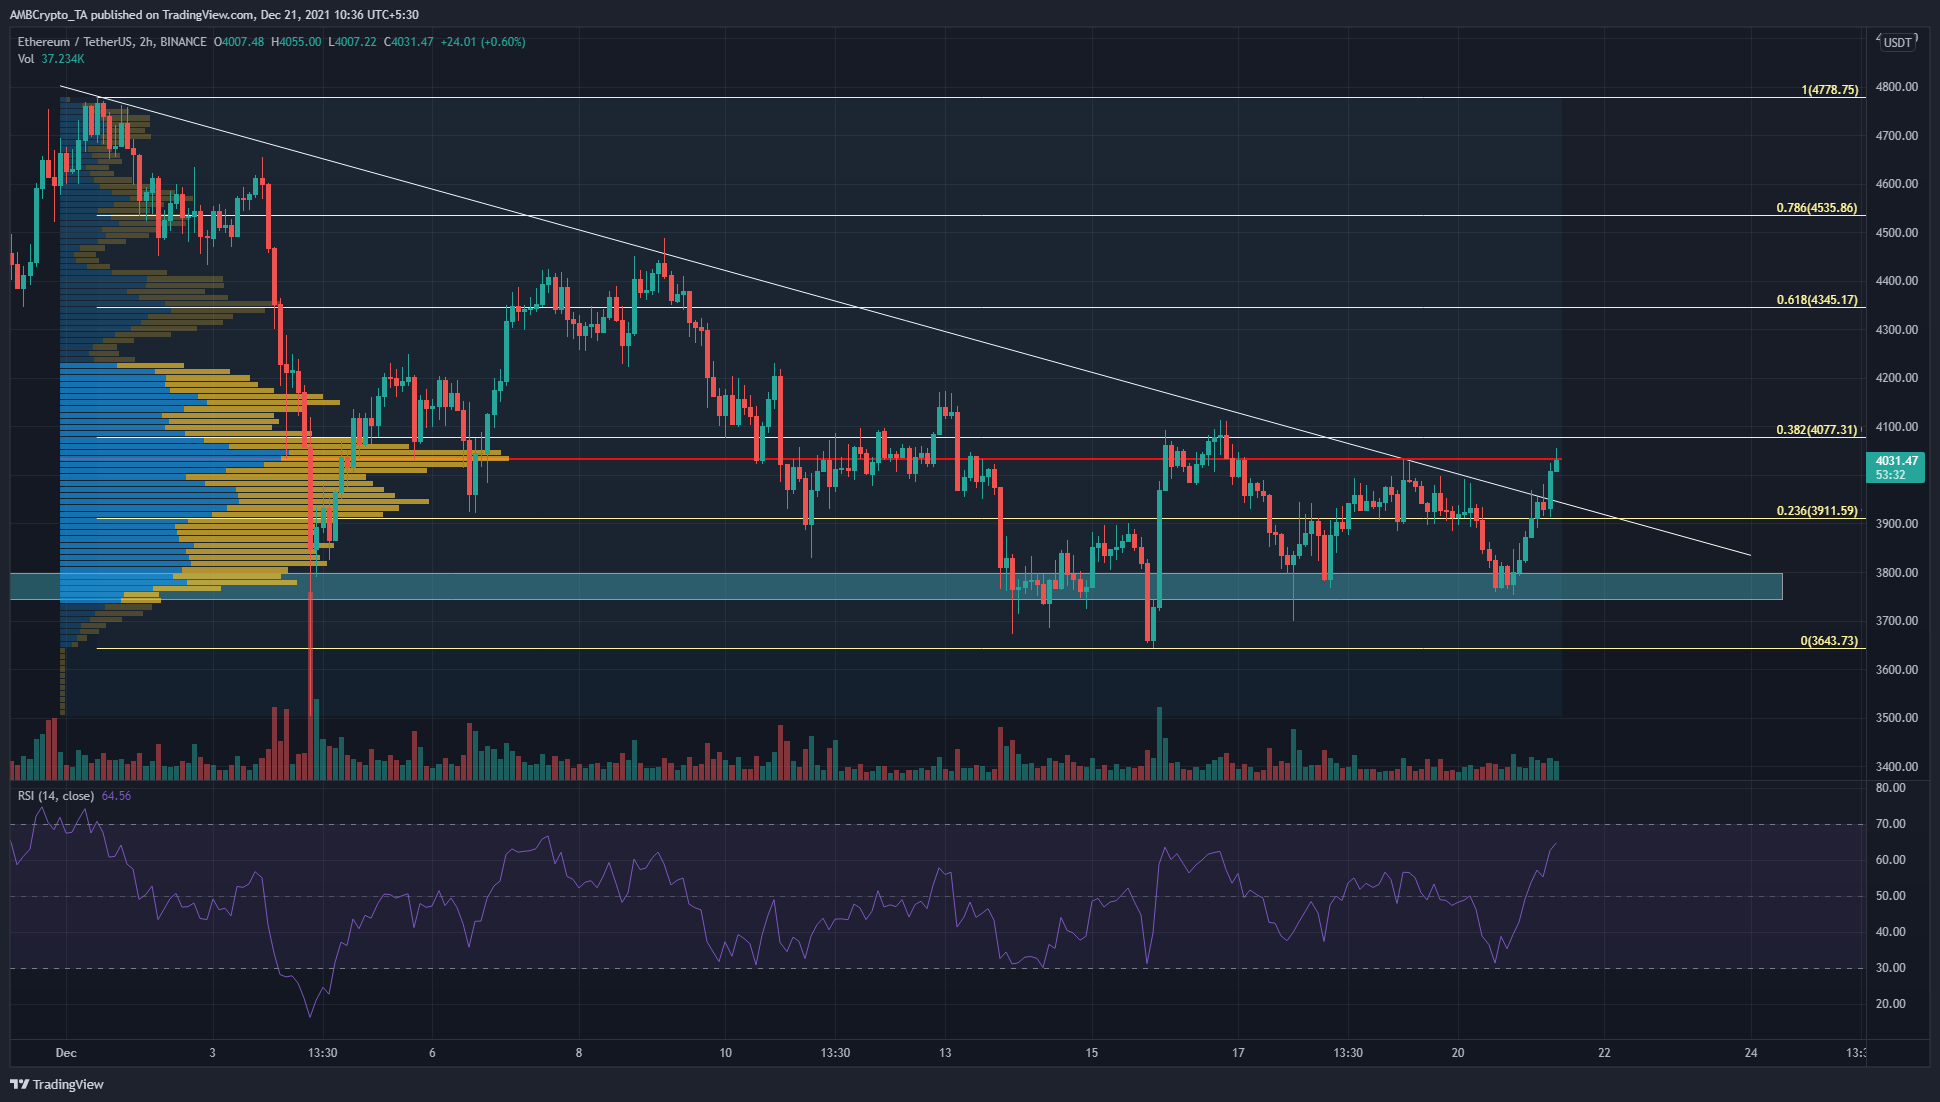
ETH visited the $3800 area (cyan box) where the bidding was strong and, coupled with a BTC bounce, ETH was also able to climb toward $4000 over the past few hours.
The Fixed Range Volume Profile for the month of December showed the Point of Control (red) to be at $4035, where ETH was trading at the time of writing. The $4000-$4100 is an area that could see heavy selling pressure.
ETH also broke out past a descending trendline resistance from early December, and the RSI showed bullish momentum behind ETH on the 2-hour chart. The Fibonacci retracement levels plotted showed the 38.2% level at $4077.
An hourly or 4-hour candle close above $4100 on heavy volume would indicate bullish strength.
EOS
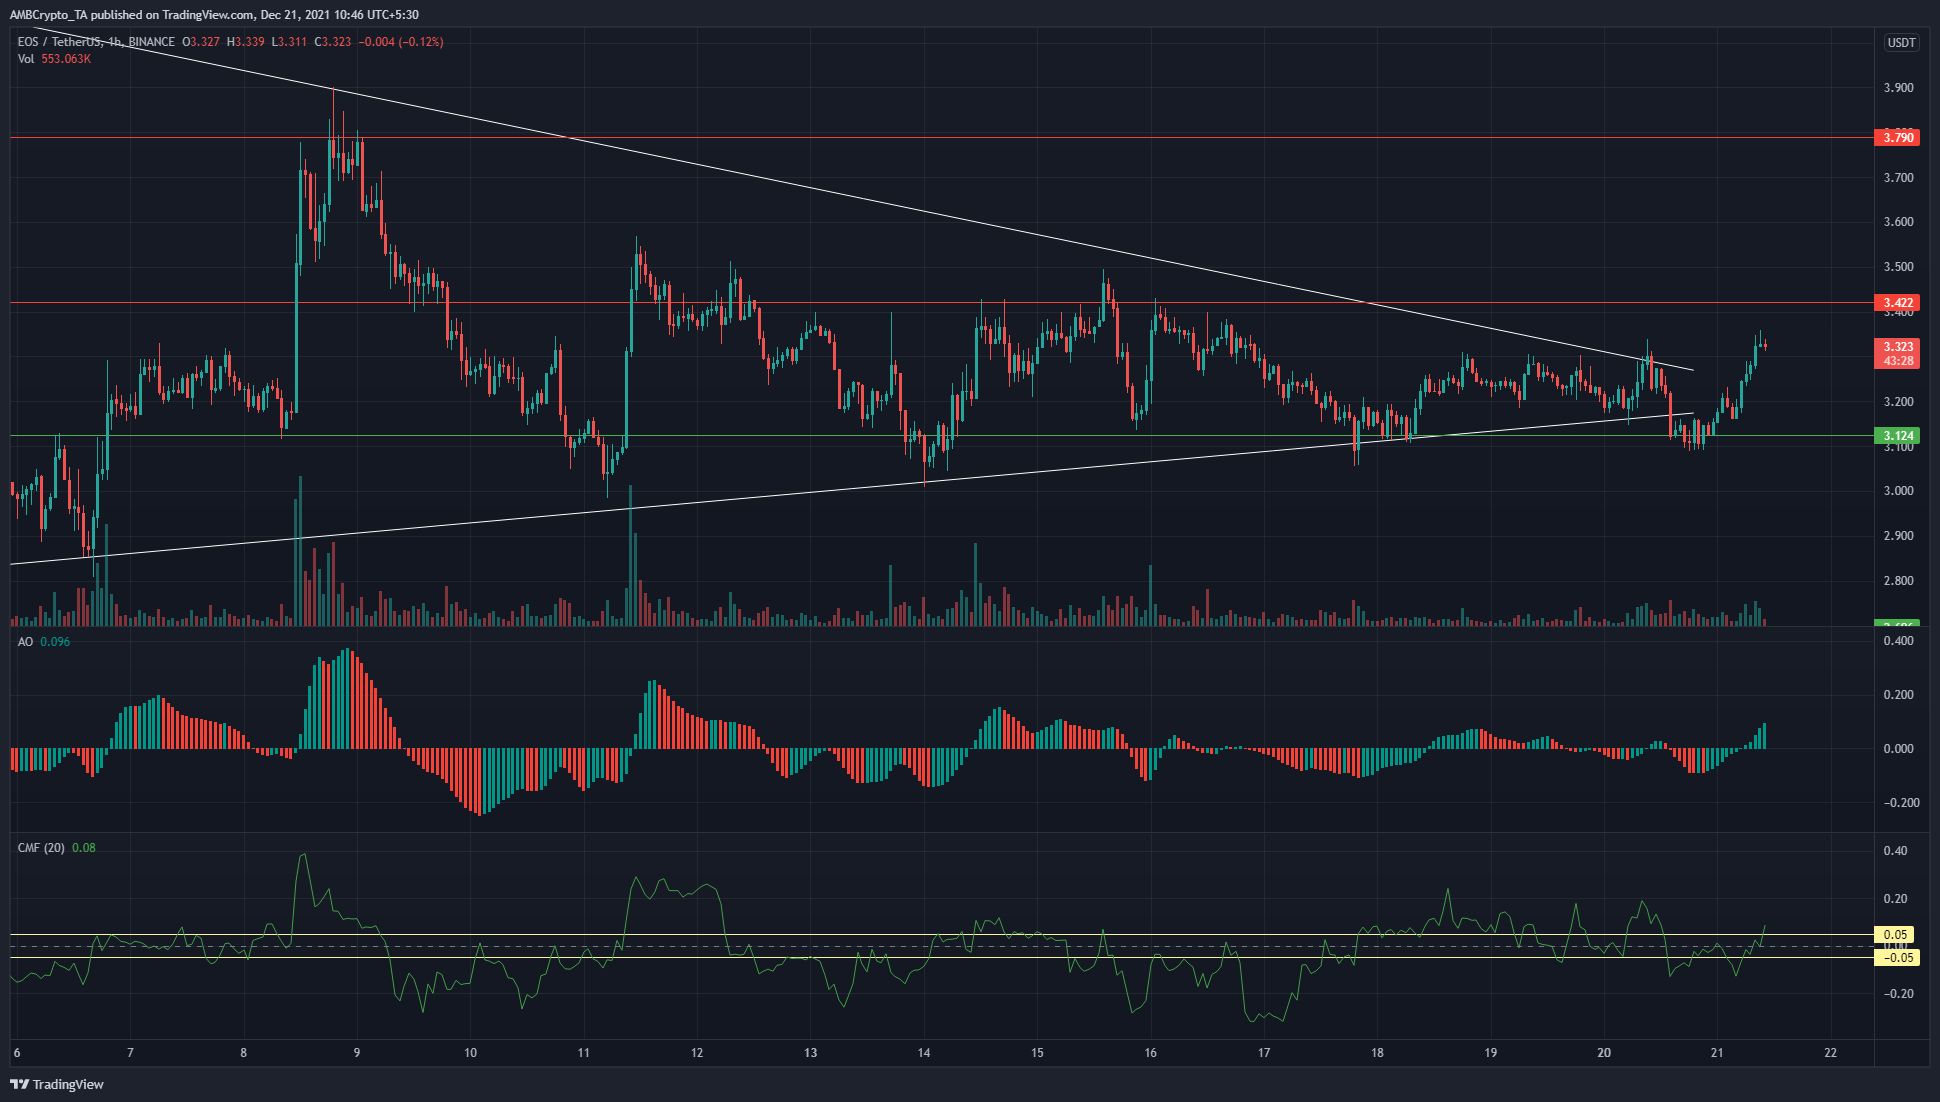
EOS had been compressed within a triangle pattern over the past few days, and finally saw a breakout in recent hours. There still lay an area of resistance in the $3.4-$3.5 area, as sellers had aggressively stepped in at this zone over the past few days.
The CMF indicator climbed above +0.05 to show capital flow into the market, an indication of buying strength. The Awesome Oscillator also climbed above the zero line on the hourly chart to show bullish momentum.
The false break to the downside in recent hours (beneath the lower trendline, the bounce off $3.12 support) followed by a strong lower timeframe move up, is a sign of bullish strength. However, it is not yet clear if this will translate into a higher timeframe move, as $3.5 resistance still stands strong.
VeChain [VET]
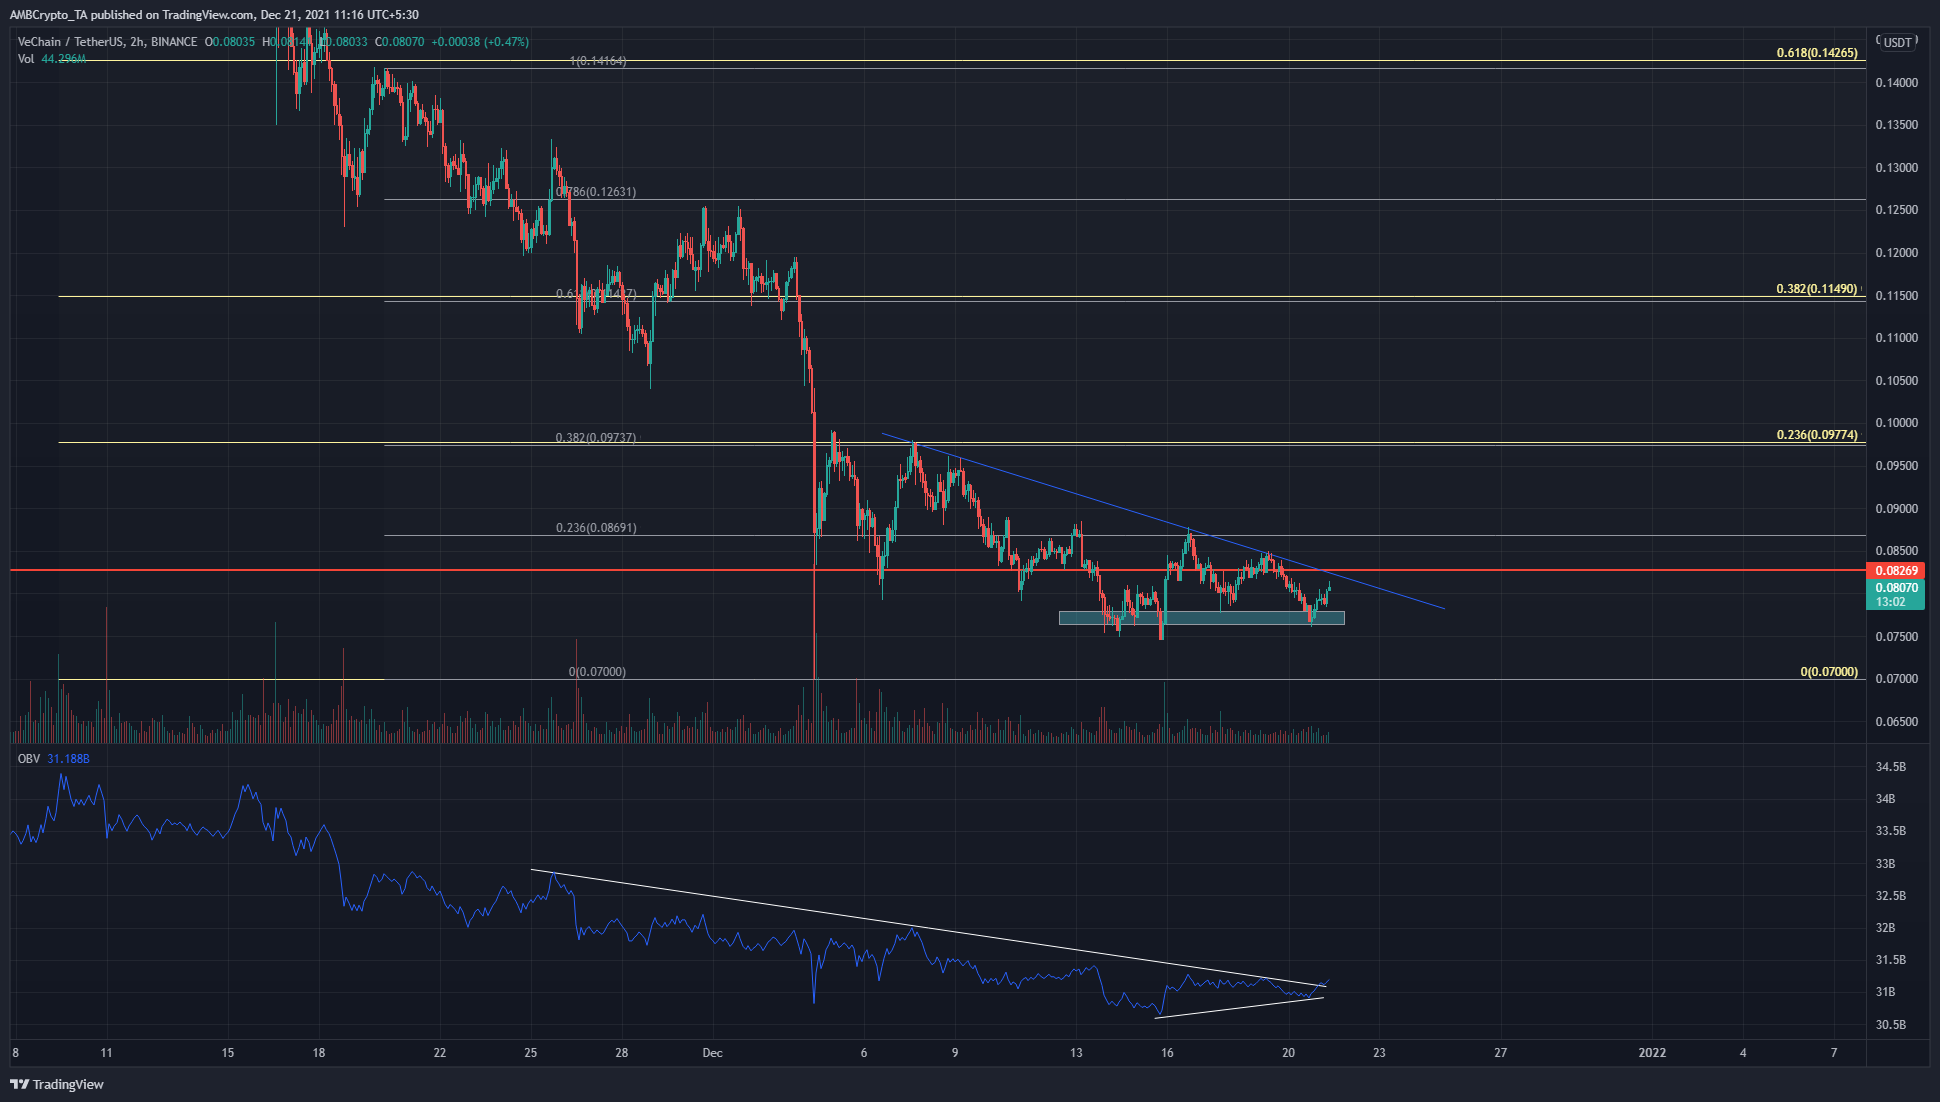
Using two sets of Fibonacci retracement levels, plotted to the same swing low of $0.07, some areas of confluence between the two sets of retracement is seen. These are areas of strong resistance, at $0.097, $0.114 and $0.142.
While the OBV appeared to breakout of a triangle pattern, the price itself was yet to climb above the trendline resistance (blue) of the past two weeks. There is also a higher timeframe resistance in the $0.082-$0.086 area.
VET would need to reclaim this area as demand, and a retest of $0.085 can b used to enter long positions.


