Ethereum, EOS, Waves Price Analysis: 22 March

Ethereum moved rangebound between $1,841.99 and $1,725.89, while the on-chain metrics showed a near-balanced market. EOS traded within an ascending channel, while Waves attempted a breakout above $10.2-resistance.
Ethereum [ETH]
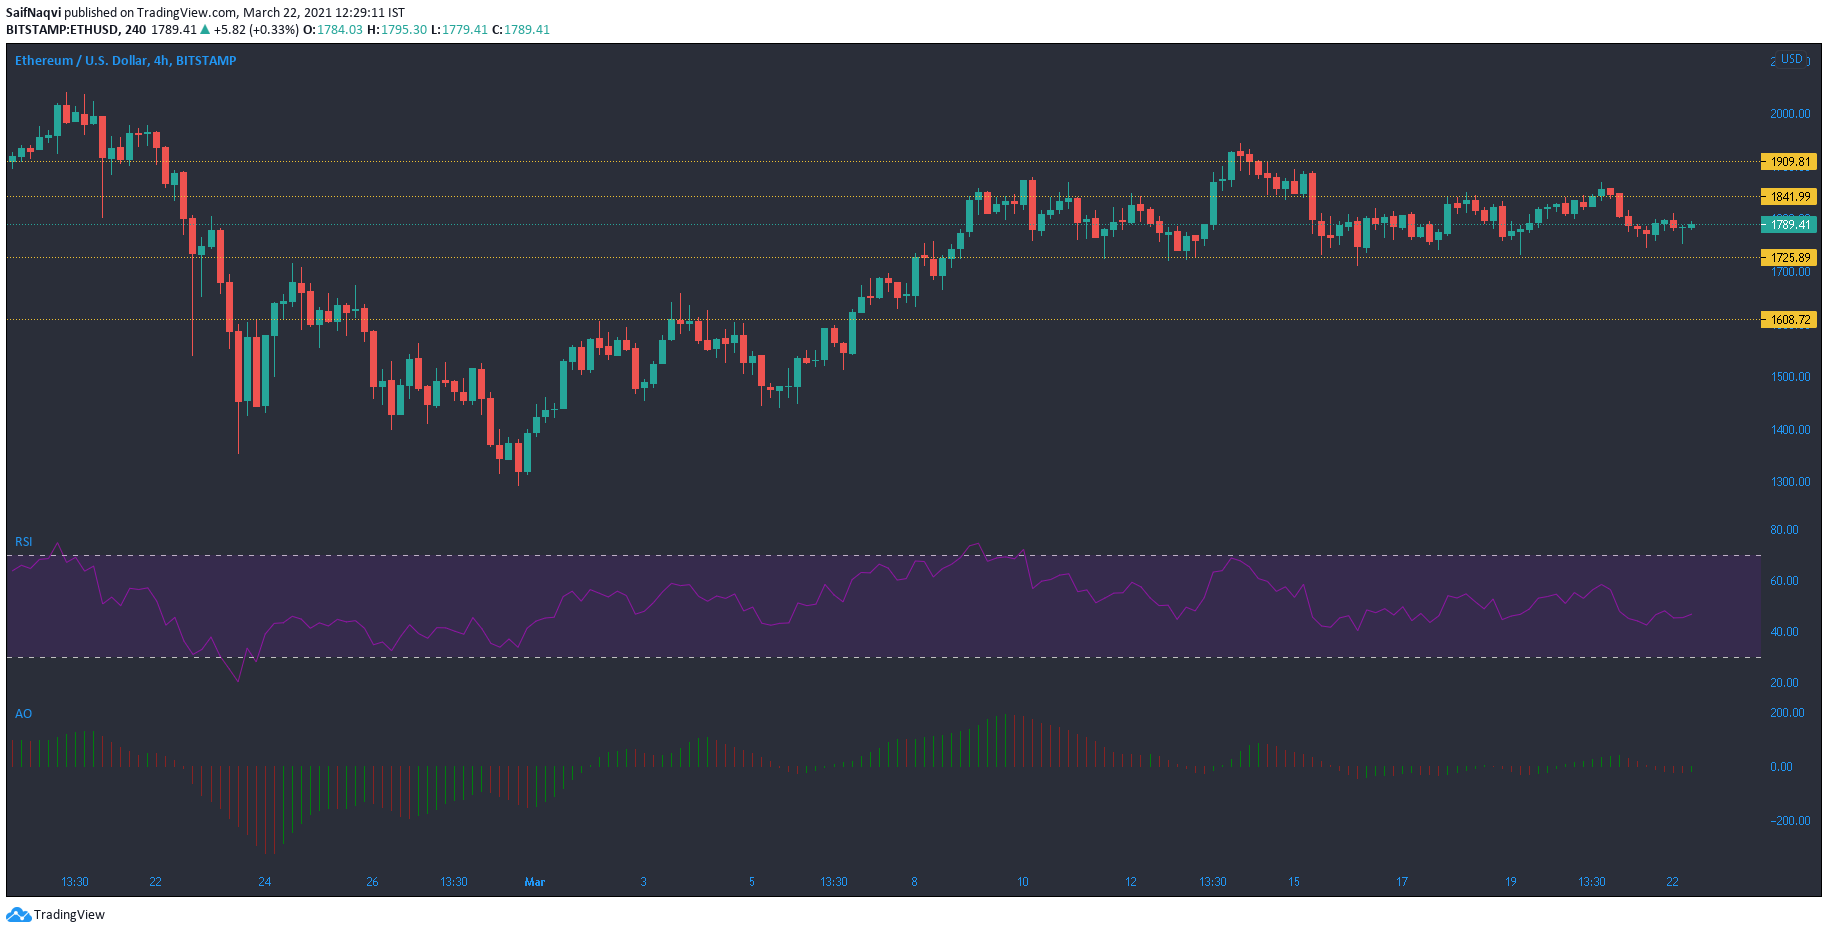
At the time of writing, the world’s largest altcoin, Ethereum, was trading at the midpoint of its immediate support and resistance and reflected a balanced market. The 24-hour trading volumes were shy of $20 Billion, and down by 23%. The indicators showed a degree of equilibrium and did not signal a break away from ETH’s current channel.
The RSI pointed north from above 40, while the Awesome Oscillator was bullish-neutral. The short-term target for the bulls rested at a move above $1,841.9 resistance, and recapturing that level would allow for a rise towards the next target at $1,909.81. A fall below the current support-line would likely lead to a sell-off towards $1,600 and with $1.15 Billion ETH options set to expire on March 26, there was a chance for a dip towards that lower level.
EOS
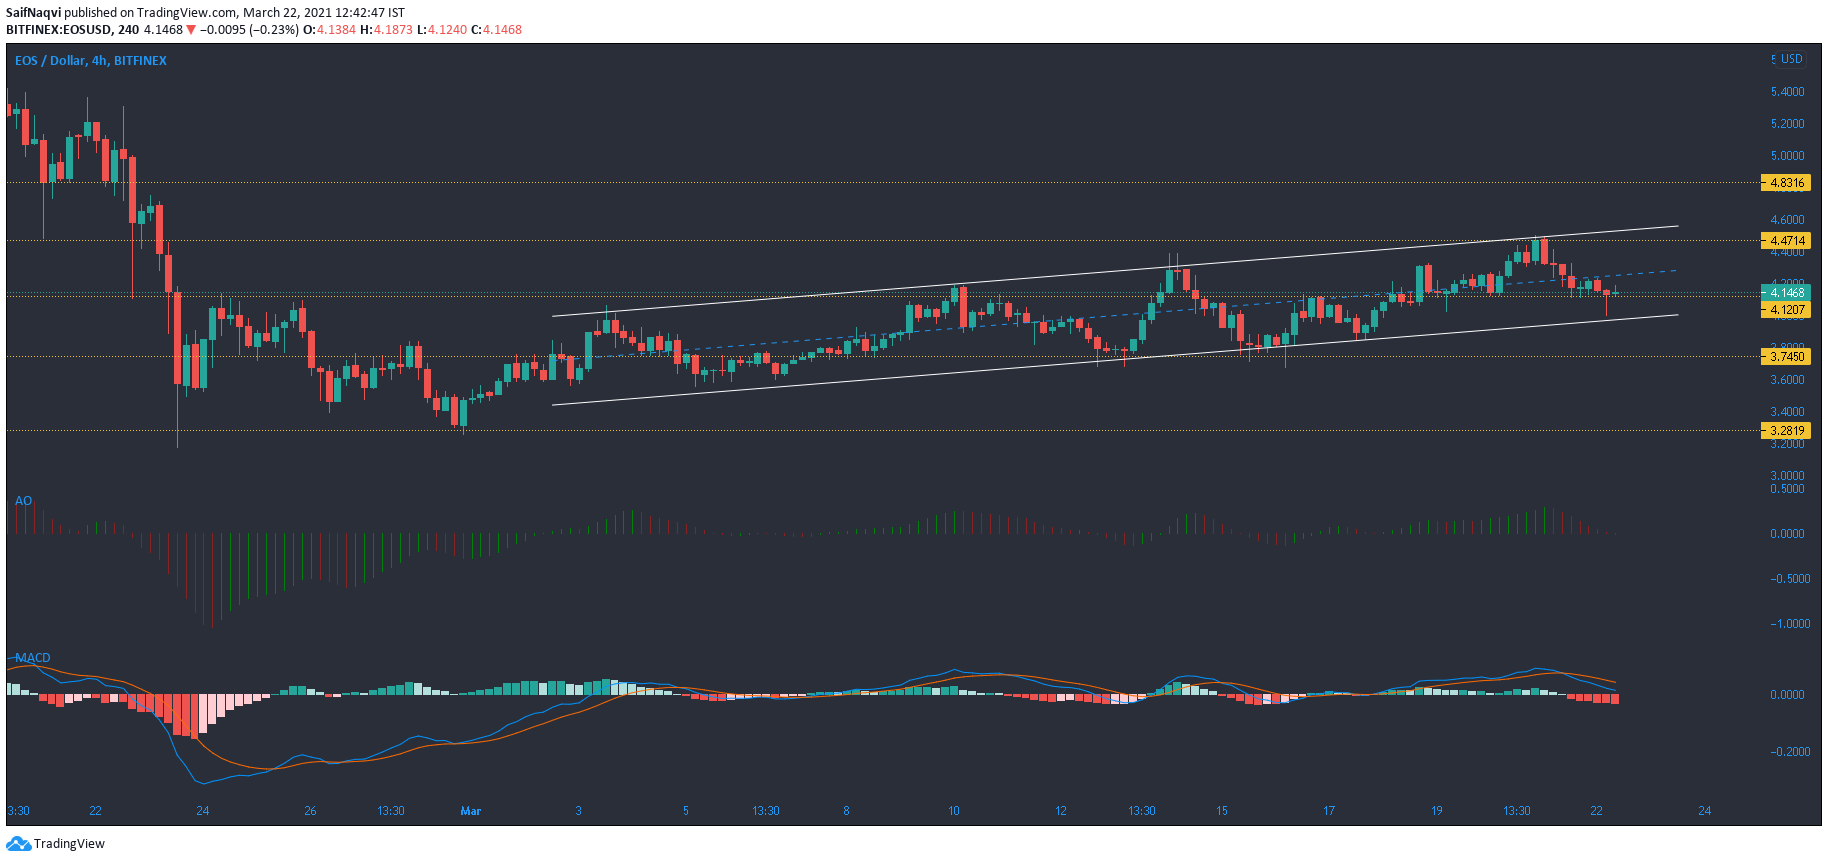
A bounce back from $3.28-support saw EOS snap higher highs and higher lows, which led to the emergence of an up channel on the 4-hour timeframe. Even though the price was in the red at press time, it remained within the confines of the pattern. However, bearish indicators suggested that EOS was in danger of falling below $4.12 support, and a move below the lower trendline would likely indicate a trend reversal.
The MACD line traded well under the signal line, while a red bar on the Awesome Oscillator even fell below the half-line. If the bulls avoid a breakdown from the channel, the price would likely head north and above $4.47-resistance in the coming sessions.
Waves [WAVES]

Unlike EOS, Waves saw gains over the last 24 hours and the price was close to breaking above $10.2-resistance. However, the area above $10 has generally seen some selling pressure and it would be interesting to note if the bulls could sustain higher levels in the event of a breakout. The OBV would need to continue its upwards trajectory and show healthy buying pressure in the market.
The Stochastic RSI showed a bearish divergence as WAVES moved below the $10-mark, but a pickup from the oversold region saw the price move higher once again. A rise towards the upper region would reflect in the price as well and boost it to the next target at $11.06.