Ethereum [ETH] investors must know this before opening a long position

Disclaimer: The findings of the following analysis are the sole opinions of the writer and should not be considered investment advice.
After a brief month-long uptrend until mid-August, Ethereum [ETH] bears were back in the game post the rising wedge breakdown. This reversal aided the sellers in pulling ETH below its daily 20/50/200 EMA.
The king alt now stood in an important region. A convincing drop below the $1,513 level would propel a further decline before near-term revival chances. At press time, the alt was trading at $1,503.2, down by 9.43% in the last 24 hours.
ETH Daily Chart
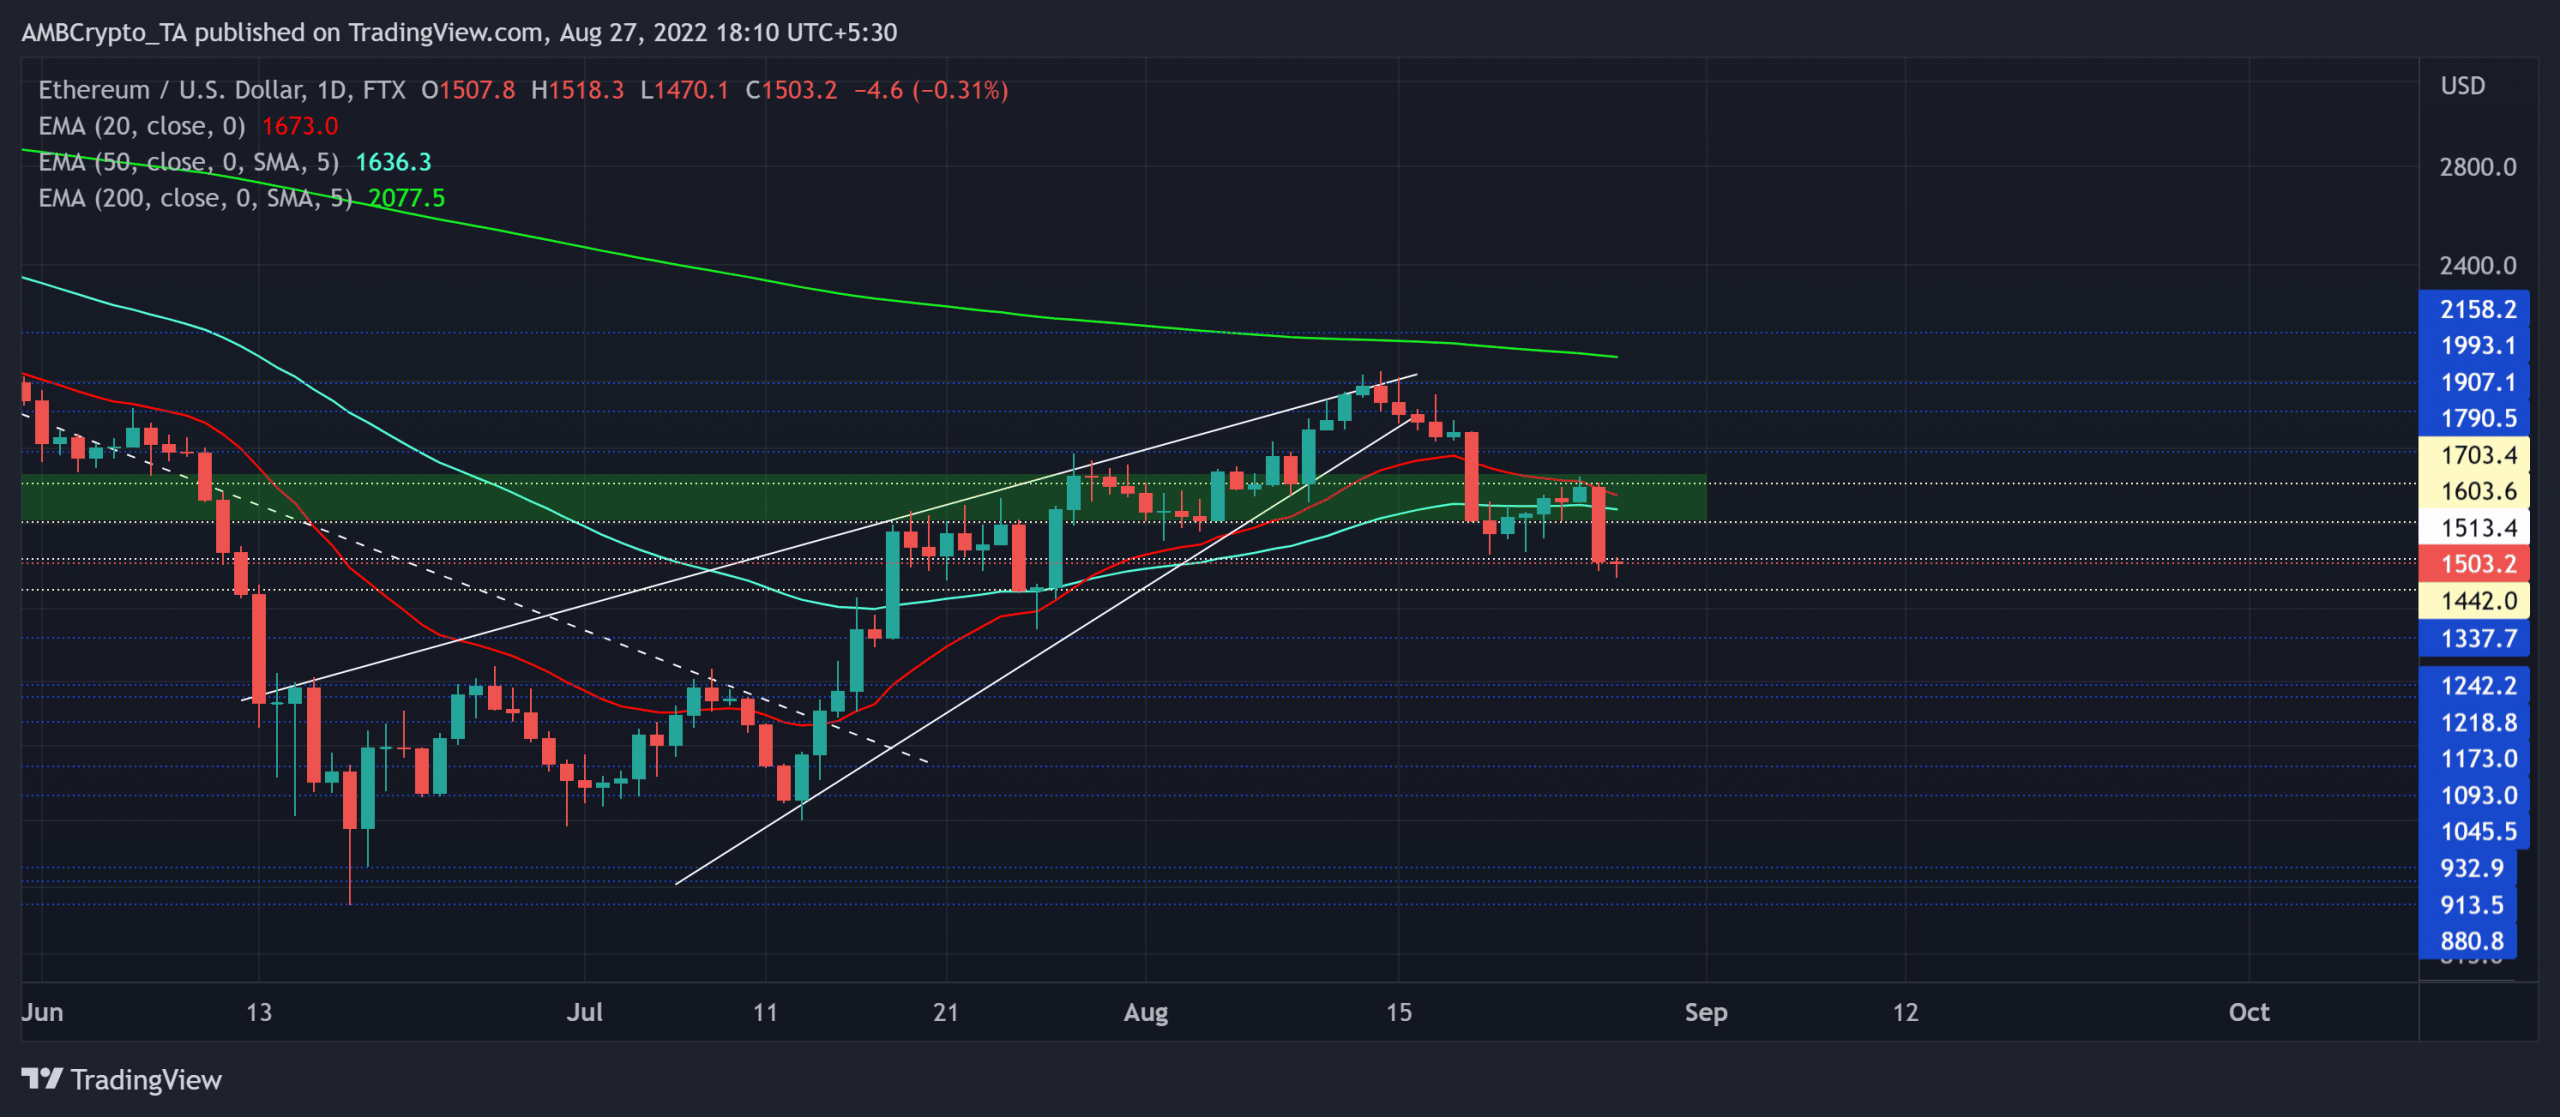
The buying pressure from ETH’s mid-June lows forced a push above the 20 EMA (red) and the 50 EMA (cyan). The altcoin saw an over 73% Return on Investment (ROI) from its 13 July low and reached near the 200 EMA (green) to depict an increasing buying edge.
But the $1,993-level resistance evoked a rising wedge breakdown. The recent losses pulled ETH below its immediate supply zone (green, rectangle).
Should the 20/50 EMA undertake a bearish crossover, the bears would look to continue their long-term edge on the chart. So a convincing close below the $1,500 zone could aid ETH in retesting the $1,440 level. A decline below this support could provoke a price discovery. Any rebound from the immediate support could hint at a near-term revival toward the $1,603 level.
Rationale
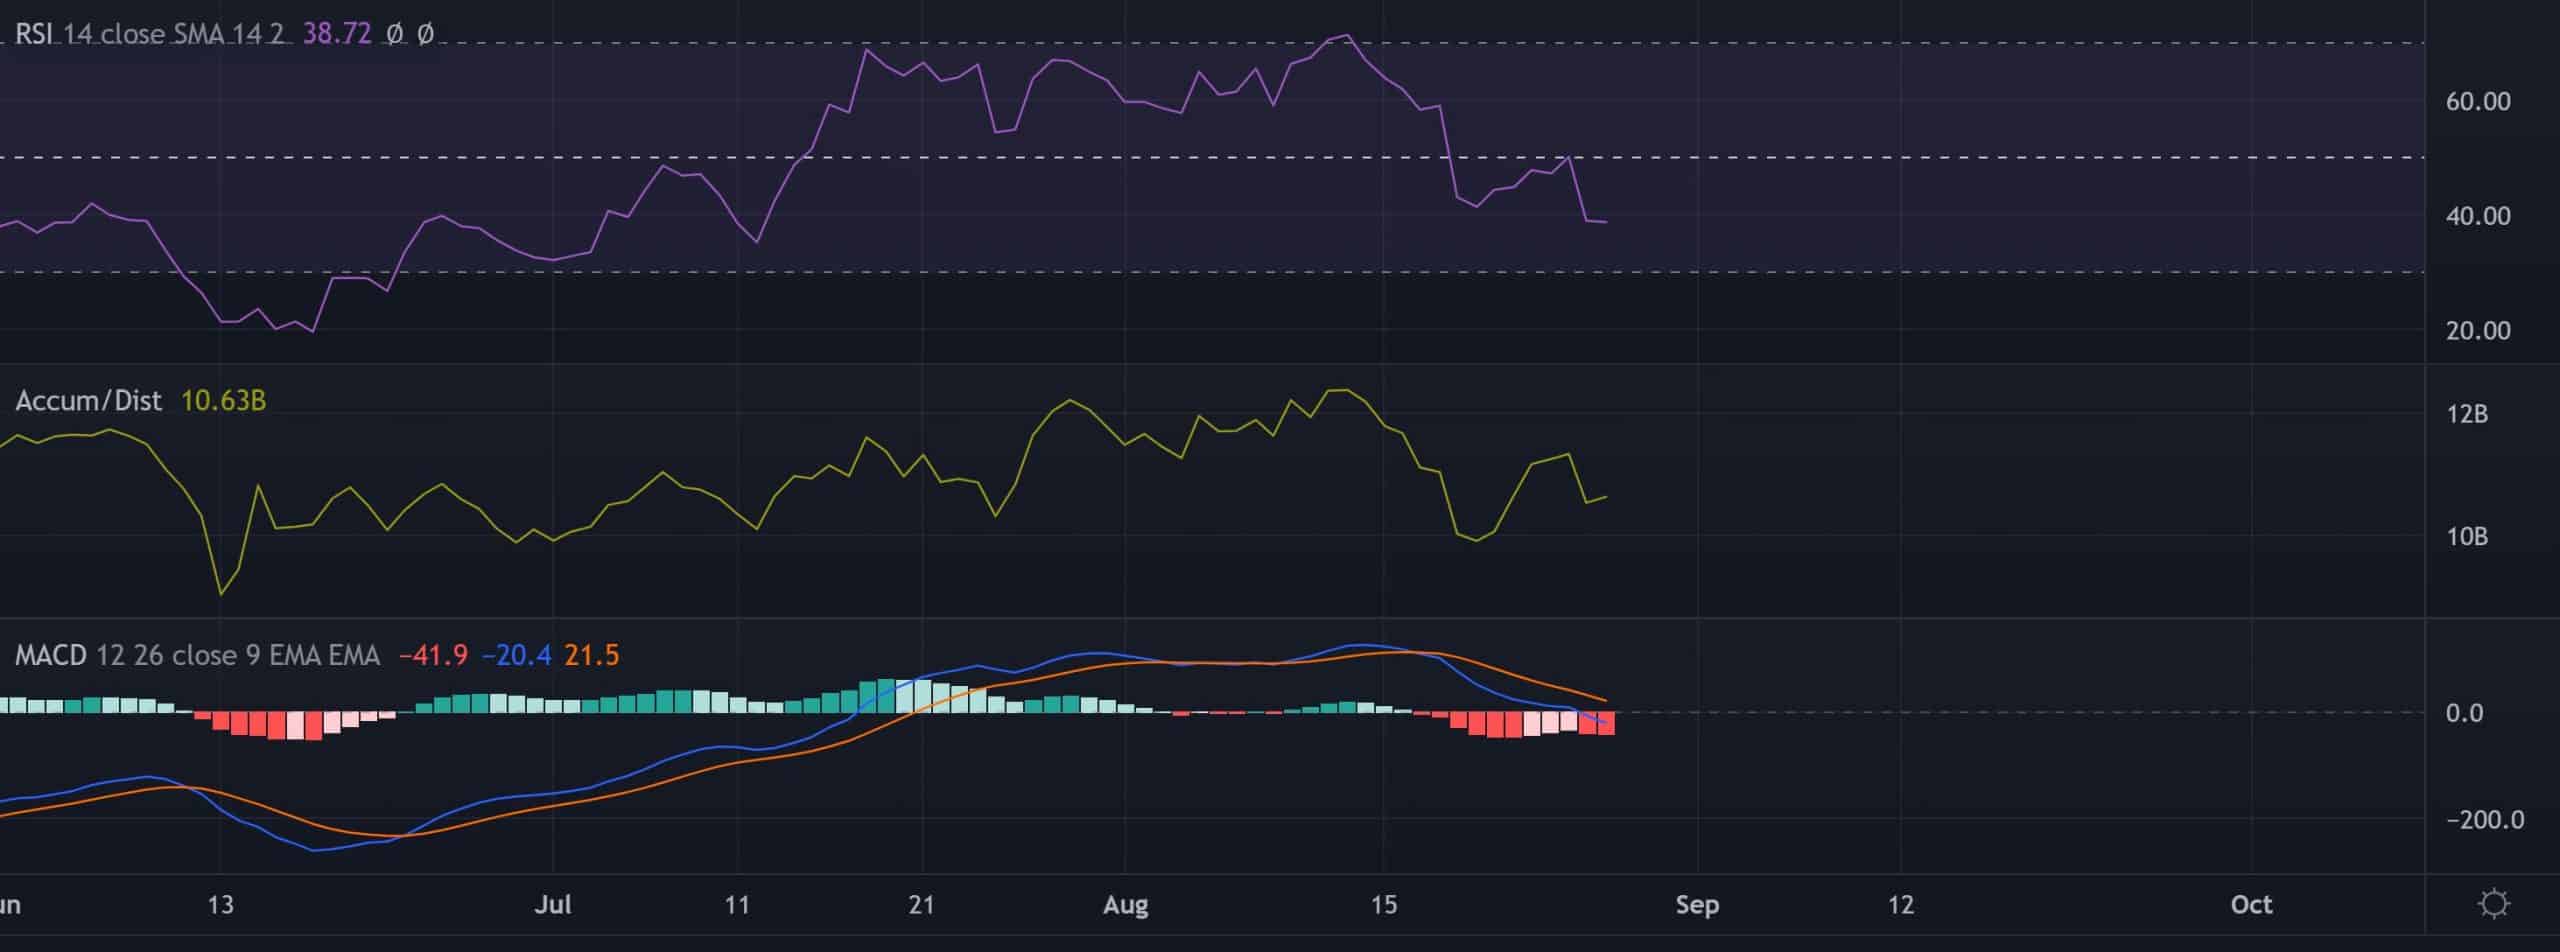
The Relative Strength Index (RSI) steeply fell below the midline to reflect a robust selling advantage. Traders/investors should watch for a revival towards the 50-level support to identify chances of a bearish invalidation.
The Accumulation/Distribution indicator, on the other hand, marked higher troughs and bullishly diverged with the price. A continued recovery could hint at a likely accumulation phase that could ease the recent selling pressure.
Nevertheless, the Moving Average Convergence Divergence (MACD) lines depicted a strong selling edge while its lines were on the verge of dropping below the zero mark.
Conclusion
Given the rising wedge breakdown declining below the south-looking 20/50 EMA, the bears would aim to take control of the near-term trend. The potential buying/selling targets would remain the same as discussed above.
Finally, investors/traders need to watch out for Bitcoin’s movement. This is because ETH shares an 82% 30-day correlation with the king coin.