Ethereum [ETH] Price Analysis: 20 October
![Ethereum [ETH] Price Analysis: 20 October](https://ambcrypto.com/wp-content/uploads/2022/10/Untitled-design-30.png)
Disclaimer: The findings of the following analysis are the sole opinions of the writer and should not be considered investment advice.
- Ethereum’s continuation chart pattern could present buying opportunities in the four-hour timeframe.
- The king alt registered improvements in its funding rates over the last week.
Ethereum [ETH] lost a third of its value in its mid-September reversal from its six-month trendline resistance (white, dashed). The subsequent decline below the 20 EMA (red), 50 EMA (cyan), and 200 EMA (green) put the altcoin on its bearish track.
Here’s AMBCrypto’s price prediction for Ethereum [ETH] for 2023-24
Should the $1,275 support stand sturdy, it could invalidate the likely bearish inclinations. At press time, ETH was trading at $1,294.8.
ETH witnessed a symmetrical triangle, is a breakout due?
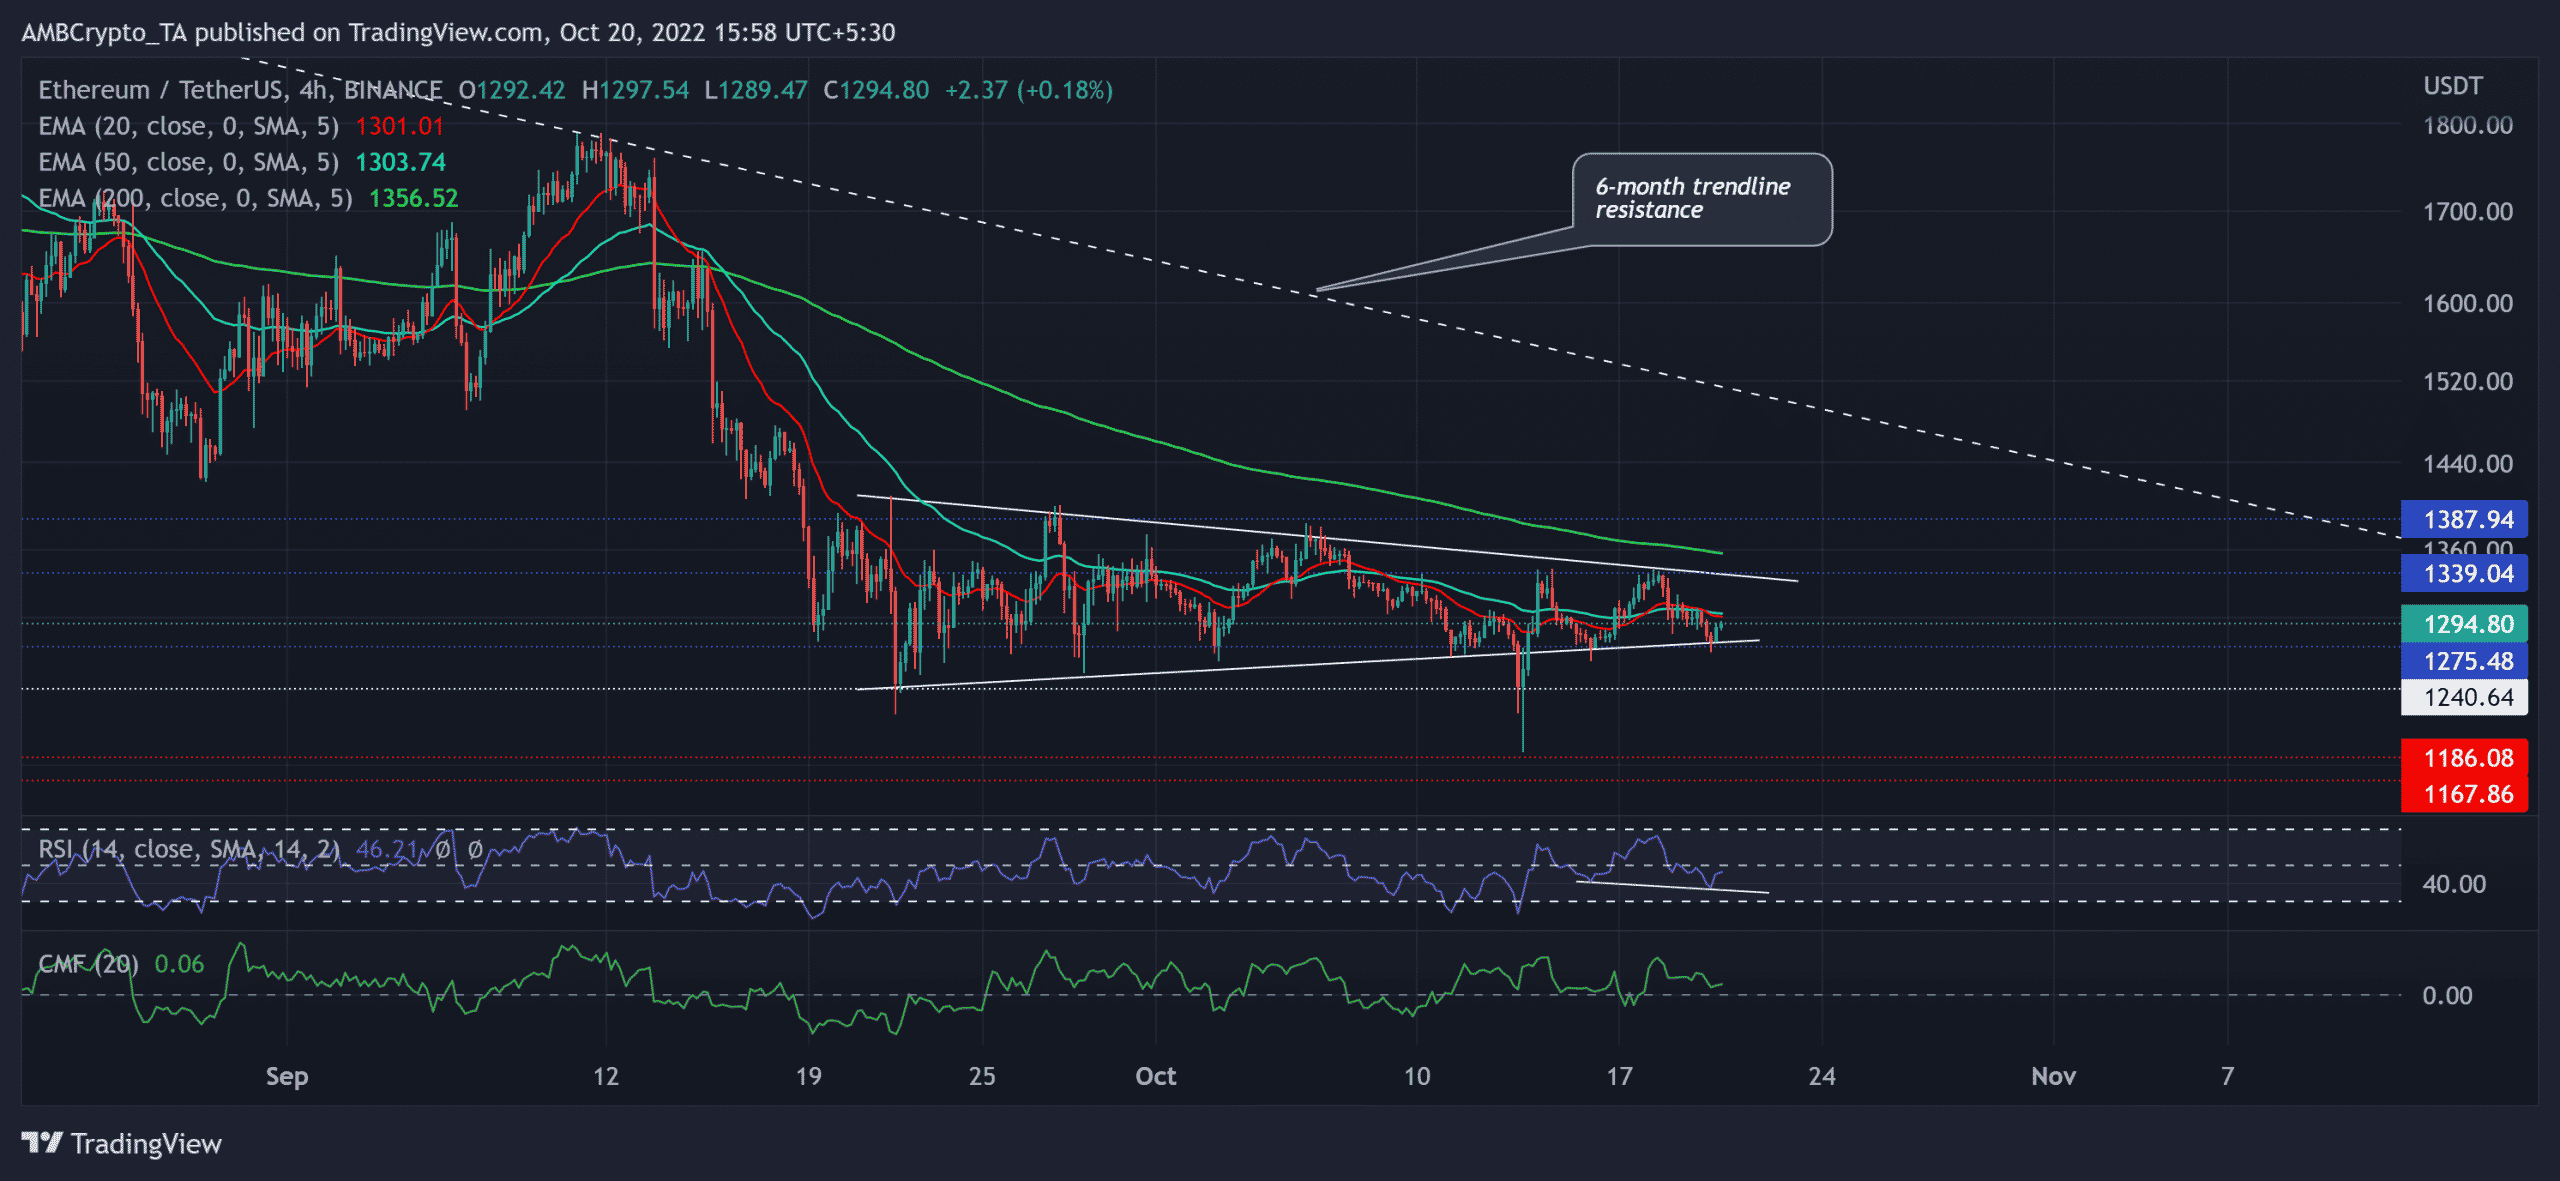
The recent price movements chalked out a symmetrical triangle-like setup after a steep downtrend in the four-hour timeframe. More often than not, a symmetrical triangle acts as a continuation pattern. Consequently, a decline below the lower trendline of the triangle could expose the crypto to a near-term decline before a lift-off.
This decline could induce a retest of its first major support level in the $1,240 support zone. The buyers could then most likely strive to look for a near-term rebound. Furthermore, the 20/50 EMA bearish crossover reinforced a slight selling edge.
But an immediate break above the EMA barriers followed by the upper trendline of the triangle could invalidate the bearish inclinations. In this situation, the potential targets would lie near the 200 EMA and the $1,387 zone.
The Relative Strength Index (RSI) depicted a slight bearish edge after its decline below the equilibrium. Nonetheless, its lower troughs bullishly diverged with the price action. On the other hand, the Chaikin Money Flow (CMF) continued to depict a bullish edge by maintaining its sport above the zero mark.
Improved funding rates

Over the past week, ETH’s funding rate on Binance turned positive as a reflection of the increased bullish sentiment in the futures market. On the other hand, its rate on FTX was slightly below the 0% mark.
Should it continue to progress on the track to become positive, the near-term sentiment could aid the buyers in invalidating the bearishness.
Last but not least, investors/traders must watch out for Bitcoin’s [BTC] movement. This is because ETH shared a 40% 30-day correlation with the king coin.