Ethereum [ETH] traders can anticipate a pullback to this region
![Ethereum [ETH] traders can anticipate a pullback to this region](https://ambcrypto.com/wp-content/uploads/2022/11/PP-2-ETH-cover-e1667287627477.jpg)
Disclaimer: The findings of the following analysis are the sole opinions of the writer and should not be considered investment advice
- Ethereum surged above a range to show bullish intent
- This wave of buying could propel ETH as high as $2000
Ethereum saw powerful bullish momentum in the past week, but it slowed down in the last few days. The FOMC meeting was also around the corner, and investors could be waiting on the sidelines for the fallout before making their decisions.
Here’s AMBCrypto’s Price Prediction for Ethereum [ETH] in 2022-23
From a technical standpoint, it appeared likely that Ethereum could witness a pullback toward $1400. However, the market structure remained bullish, and such a drop would offer opportunities to buy the asset.
Daily order block offered resistance, ETH could see a dip
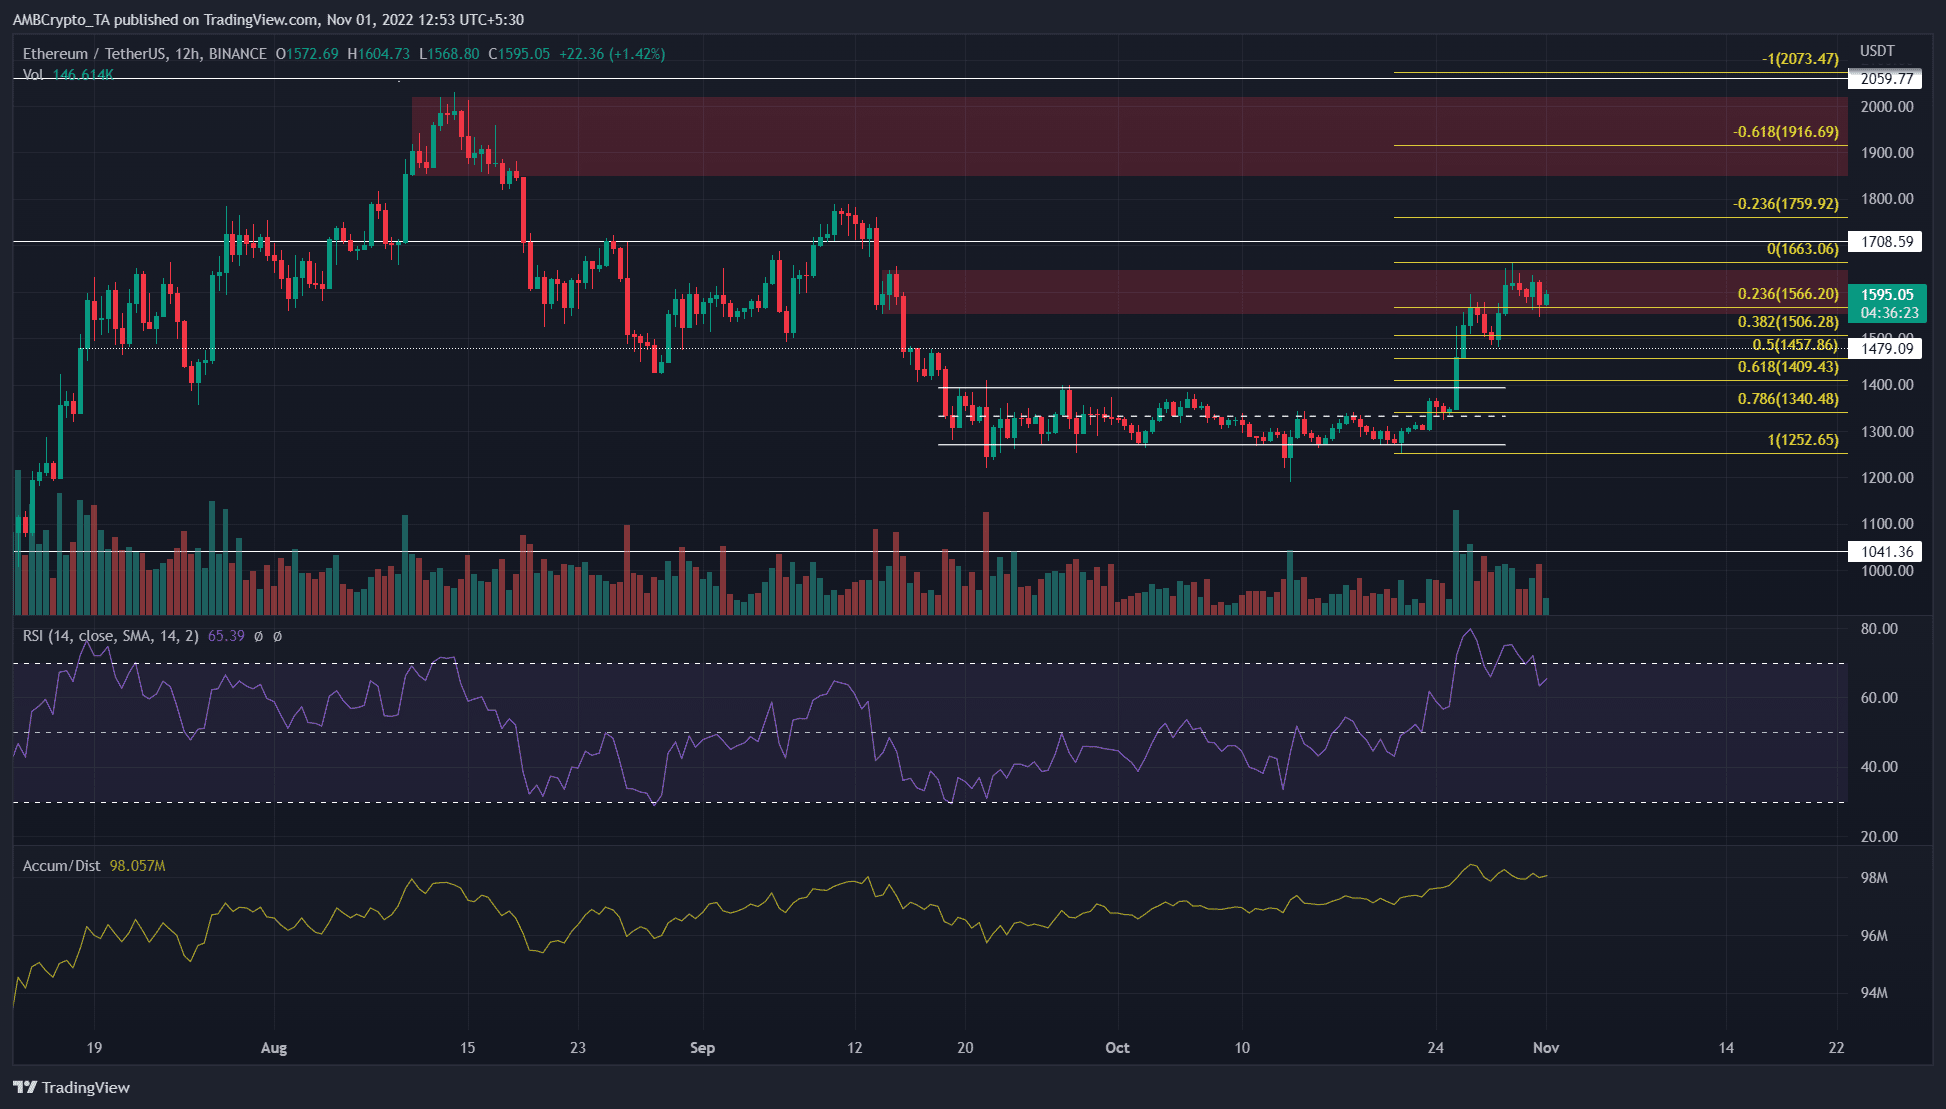
Since mid-September, Ethereum has traded within a range (white) from $1270 to $1395. The mid-point of this range lay at $1333 and has been respected as support and resistance in this period.
In the past week, Ethereum has been able to make a break above this range. It surged on massive trading volume, and the A/D indicator also showed higher lows formed. This meant buying pressure was much greater than the selling pressure, and indicated a healthy rally.
However, in the past few days, the RSI began to make a series of lower highs. In the meantime, ETH made higher highs and tried to push past the bearish order block around $1600.
The confluence of the bearish order block and the recent bearish divergence suggested that Ethereum could see a pullback on the charts. The Fibonacci retracement levels highlighted the 61.8% level to lie at $1409. Bulls can look to buy a pullback to the $1400-$1450 area.
To the north, the Fibonacci extension levels had close confluence with the $1900 resistance zone and the $2060 resistance level.
Funding rate positive and accumulation was likely
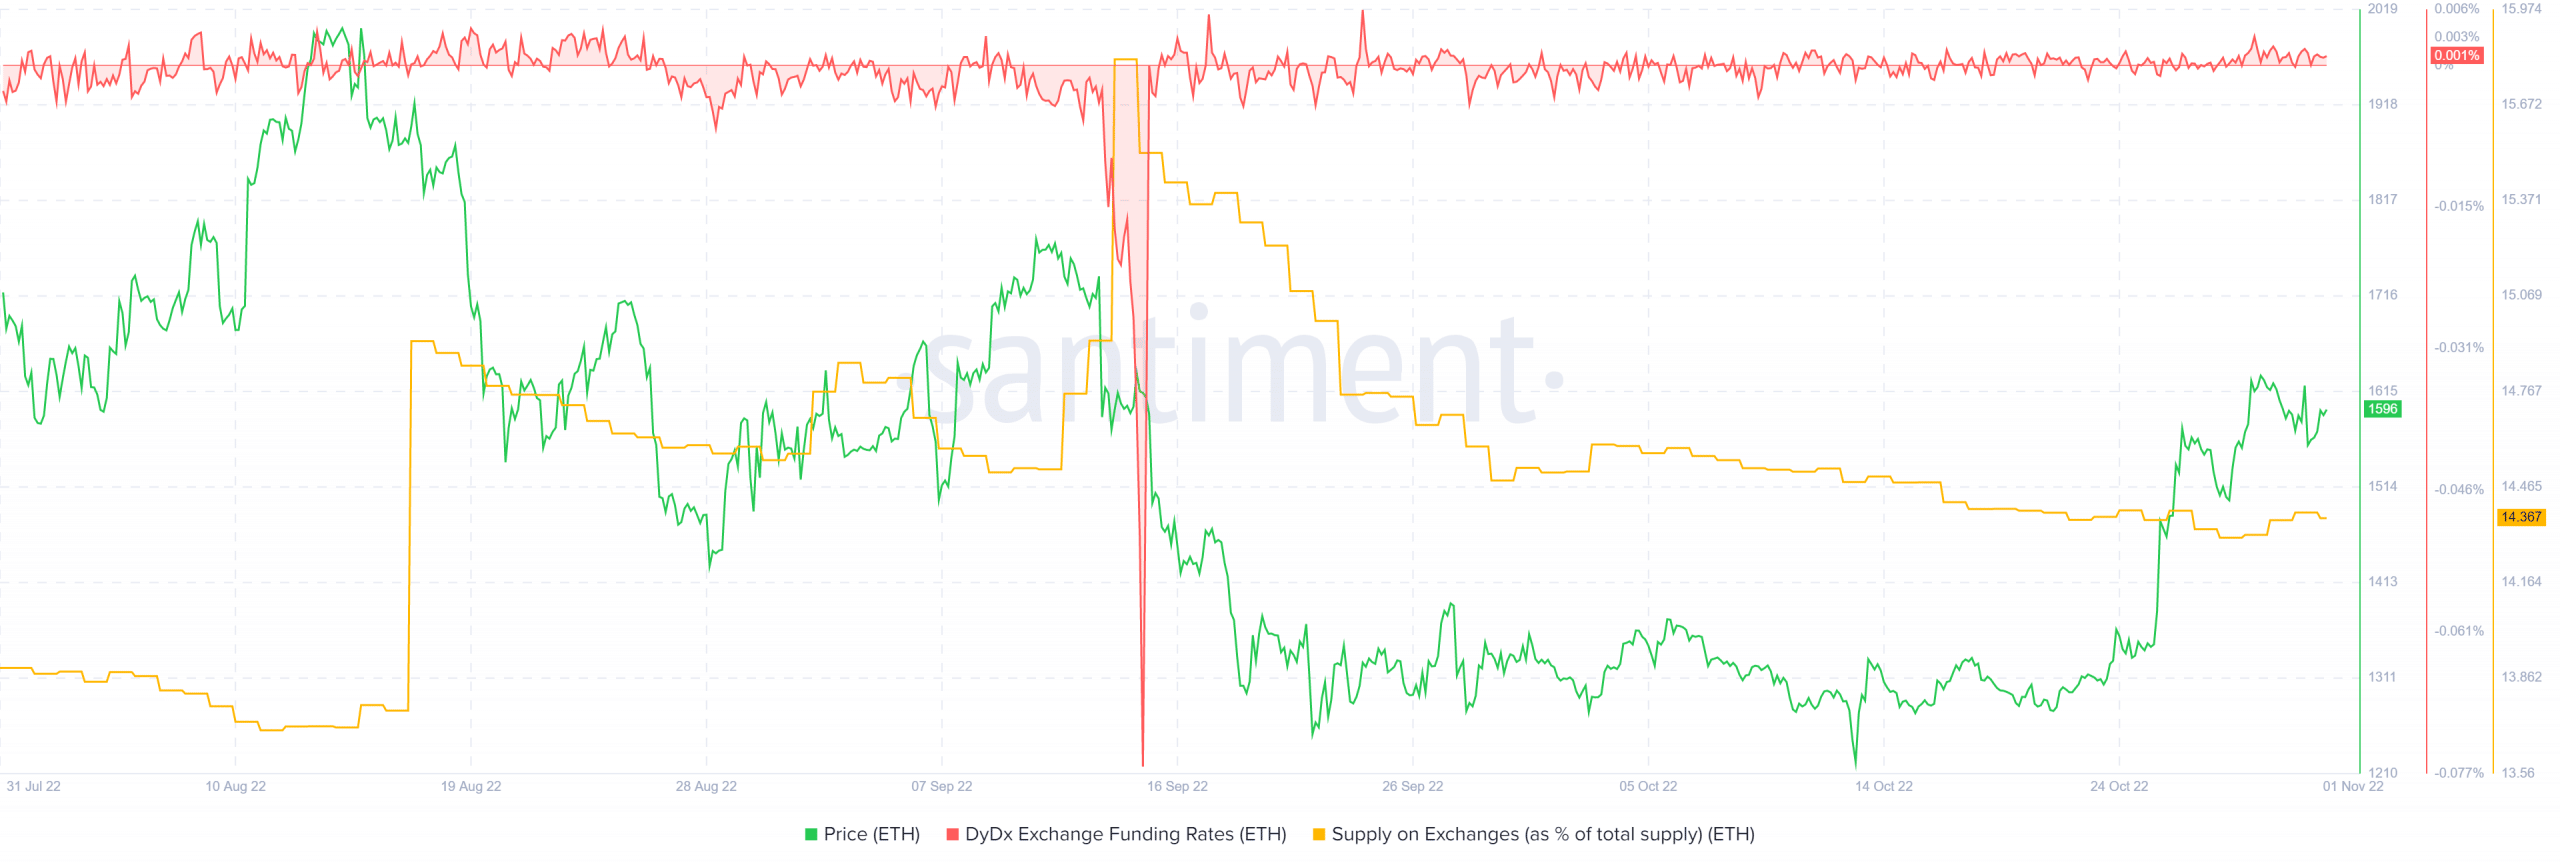
The funding rate data from Santiment showed that it was positive in recent days. This revealed long positions paid the short positions, and was a sign that speculators were bullishly positioned.
The Supply on exchanges metric was also in decline. During this time the price has surged from the $1350 area. This showed that there was a possibility of ETH being moved off the exchange wallets and into cold storage. Hence, it could be a sign of accumulation and a lack of intense selling pressure.