
Altcoins like ETH, MATIC, and AAVE began to consolidate after a brief market crash on 18 June, when Bitcoin’s price fell by 3.55%. The altcoins lost over 10% of their valuations. As bullish momentum crept in, AAVE saw a slight price increase. Meanwhile, ETH saw renewed buying pressure and MATIC saw an increase in buying pressure. The global crypto market cap was at $1.48 trillion at press time, which was a 1.33% decrease from the previous day.
Ethereum [ETH] –
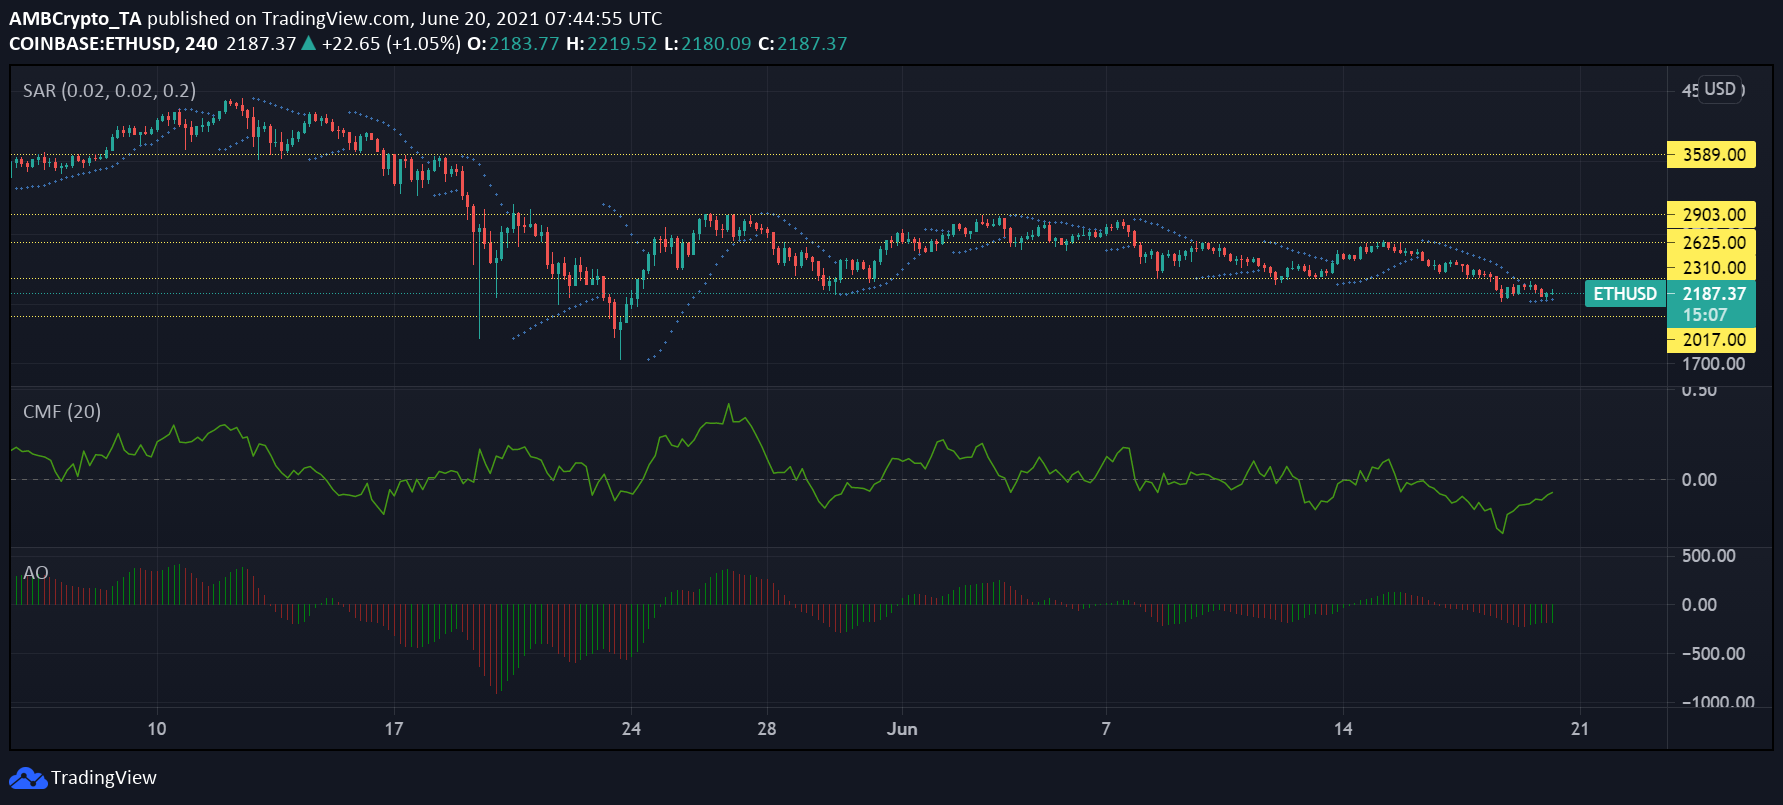
Source: ETH/USD, TradingView
The crash on 18 June caused Ether to breach $2,310-support by falling over 11%. Appearing to somewhat recover, it was trading at $2,197 at the time of writing. On Thursday, Ethereum network announced its game-plan for the London upgrade testnet launch, which will be rolled out in a phased manner in the coming weeks.
Investor interest seems to be picking up again, as Chaikin Money Flow reversed its direction on 18 June after reaching the bottom. While still below equilibrium, the indicator’s north-bound movement suggested that capital inflows were recovering during this time.
Bullish momentum was starting to surface as green lines started appearing on Awesome Oscillator’s histogram on 19 June. Around the same time, Parabolic SAR’s dotted line started hovering below the candlesticks, indicating that the coin’s price action was beginning to follow a bullish trend.
The $2,310-support level started acting as resistance, while the asset found support at $2,017. If it continues moving north on the back of its upcoming launch, it could reach its June high of $2,625.
Polygon [MATIC] –
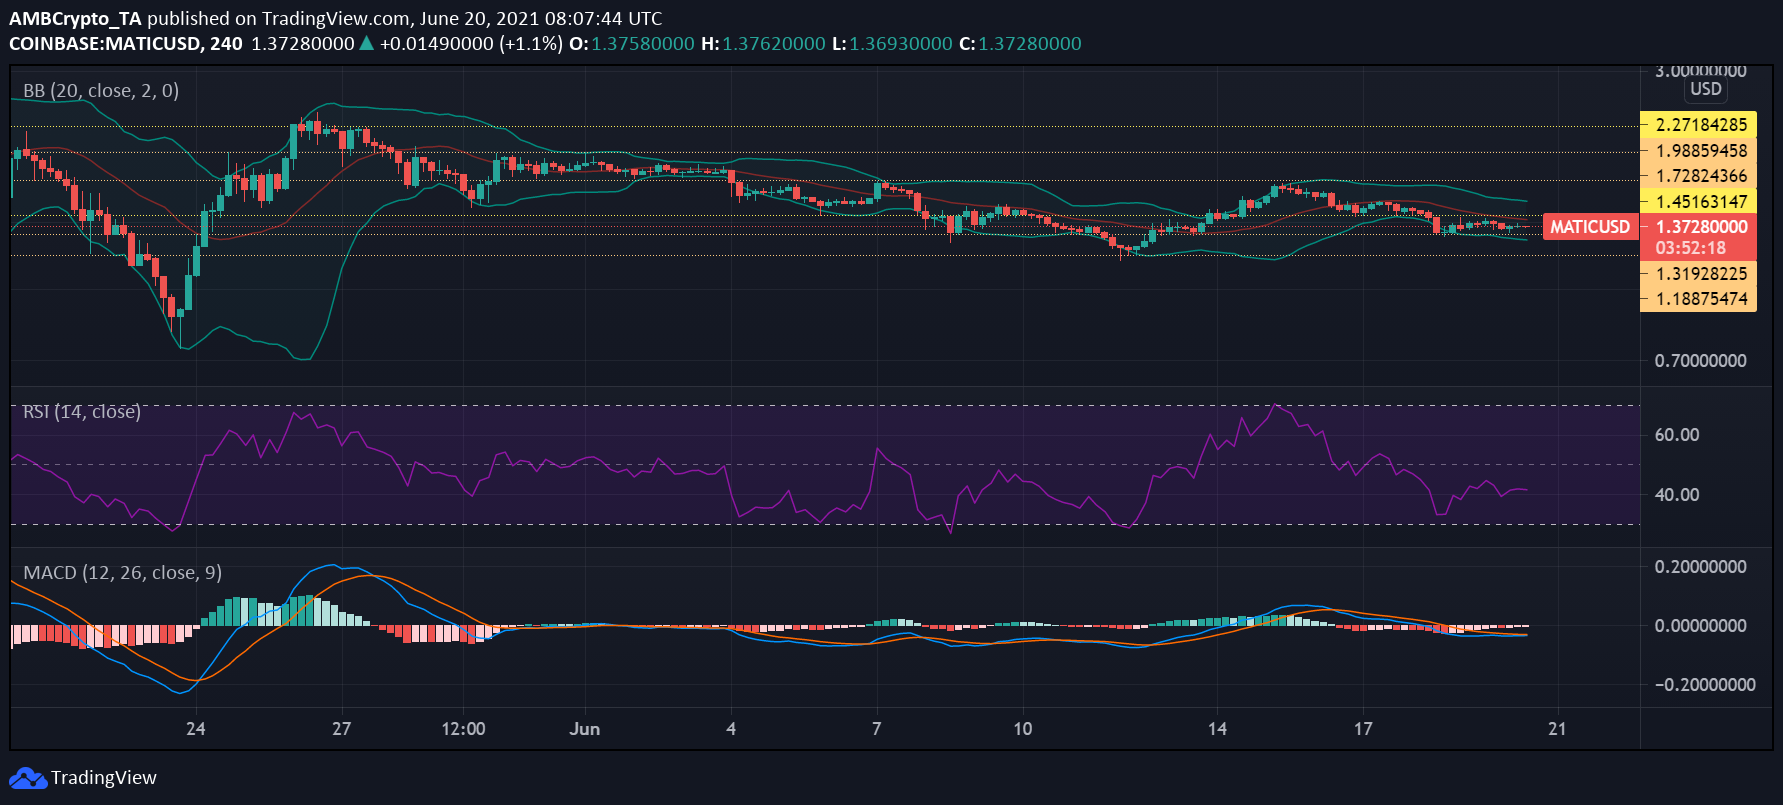
Source: MATIC/USD, TradingView
The 17th highest ranked on CoinMarketCap, MATIC’s trading volume fell by 45.26% over the past day. Trading at $1.37, the asset’s ATH of $2.62 only a month back seems far, as it broke through the $1.45 support level on 18 June to be cushioned by the $1.31 mark after falling 13%.
After a bearish crossover on 16 June, MACD lines moved in close proximity at press time. The indicator’s histogram seemed to be closing in on a bullish crossover as the coin’s price rose.
Relative Strength Index or RSI, while in the bearish territory, moved up over the past few days as buying pressure increased. The parallel movement of Bollinger Bands suggested that market volatility was stable and sharp price action could not be expected going forward. Its 30-day volatility was at 2.73 at the time of writing.
The coin’s yearly ROI was up by 17.02%. If the bulls are able to hold out, the coin could rally back up to $1.45.
Aave [AAVE] –
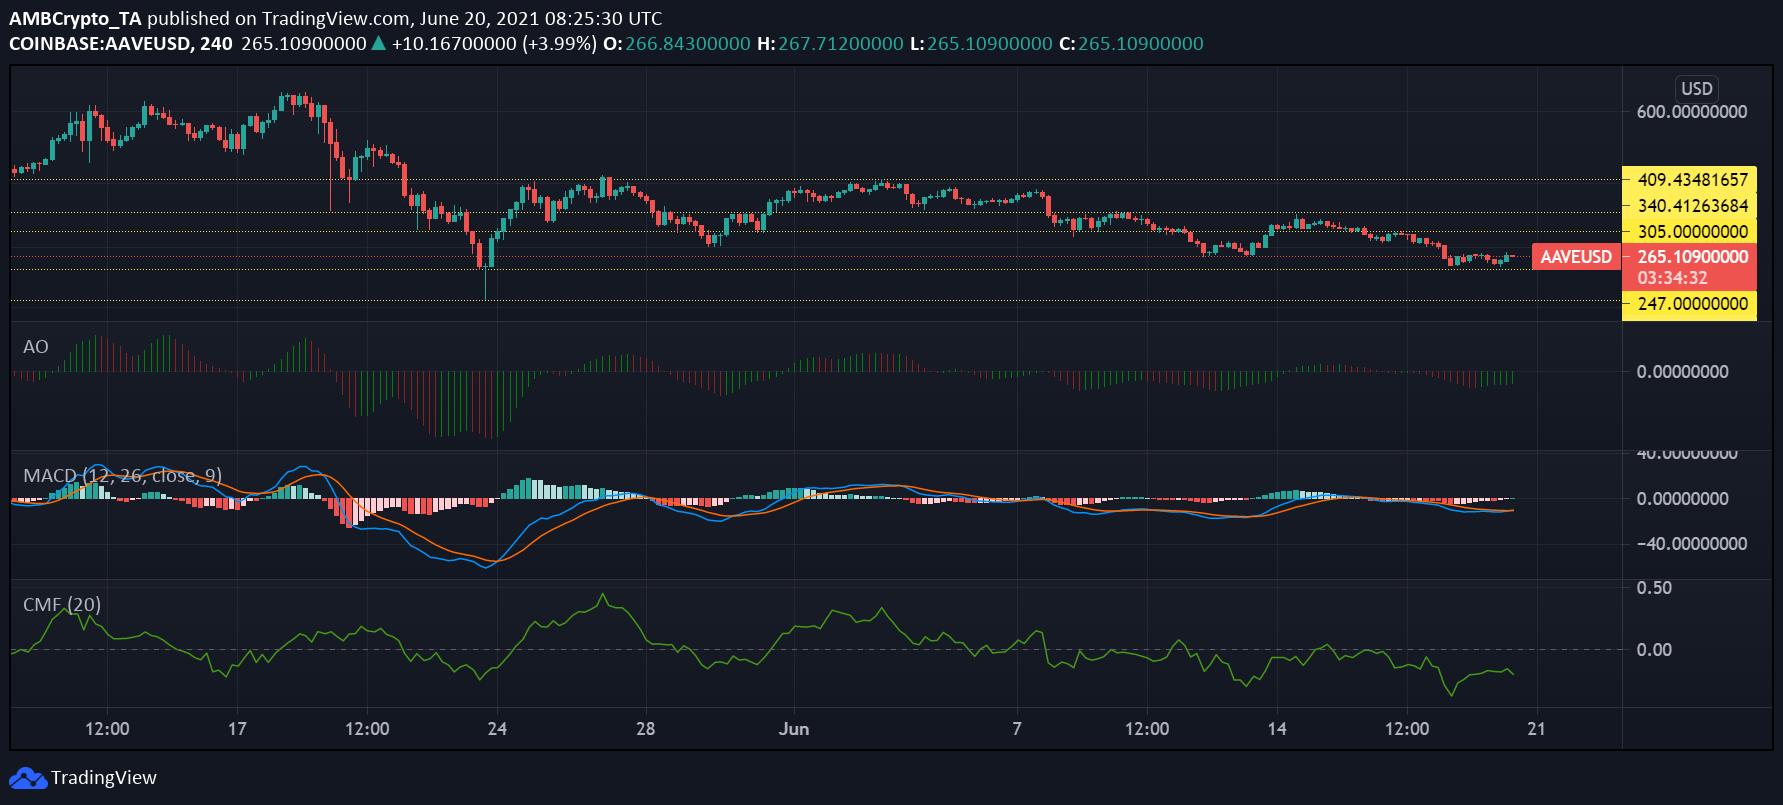
Source: AAVE/USD, TradingView
The June 18 crash led AAVE to fall by over 11%. Trading at $266 at the time of writing, the coin defended its $247 dollar support and seemed to be consolidating its price by moving sideways. While its 7-day price change was a negative 4.3%, its price rose 0.3% over the past day.
MACD lines pictured a bullish crossover as the indicator moved above the signal line, indicative of the price rise. Bullish momentum was also building on Awesome Oscillator since 19 June as green lines started to form below the histogram.
Capital inflows increased during this time as the Chaikin Money Flow began moving upward after reaching the 0.4 mark below the zero-line. However, a slight downtick in the indicator’s movement could be noticed at the time of writing.