Ethereum Price Analysis: 05 March

Disclaimer: The findings of the following analysis are the sole opinions of the writer and should not be taken as investment advice
There were some clues from a dropping Open Interest that Ethereum could see a short-term correction back under the $1600-level. Subsequently, ETH dipped below the $1580-mark and retested it as resistance, before falling even further. The altcoin’s market momentum continued to be in bearish hands, at press time, with $1450 looming as an important level of support for the bulls to defend.
Ethereum 1-hour chart
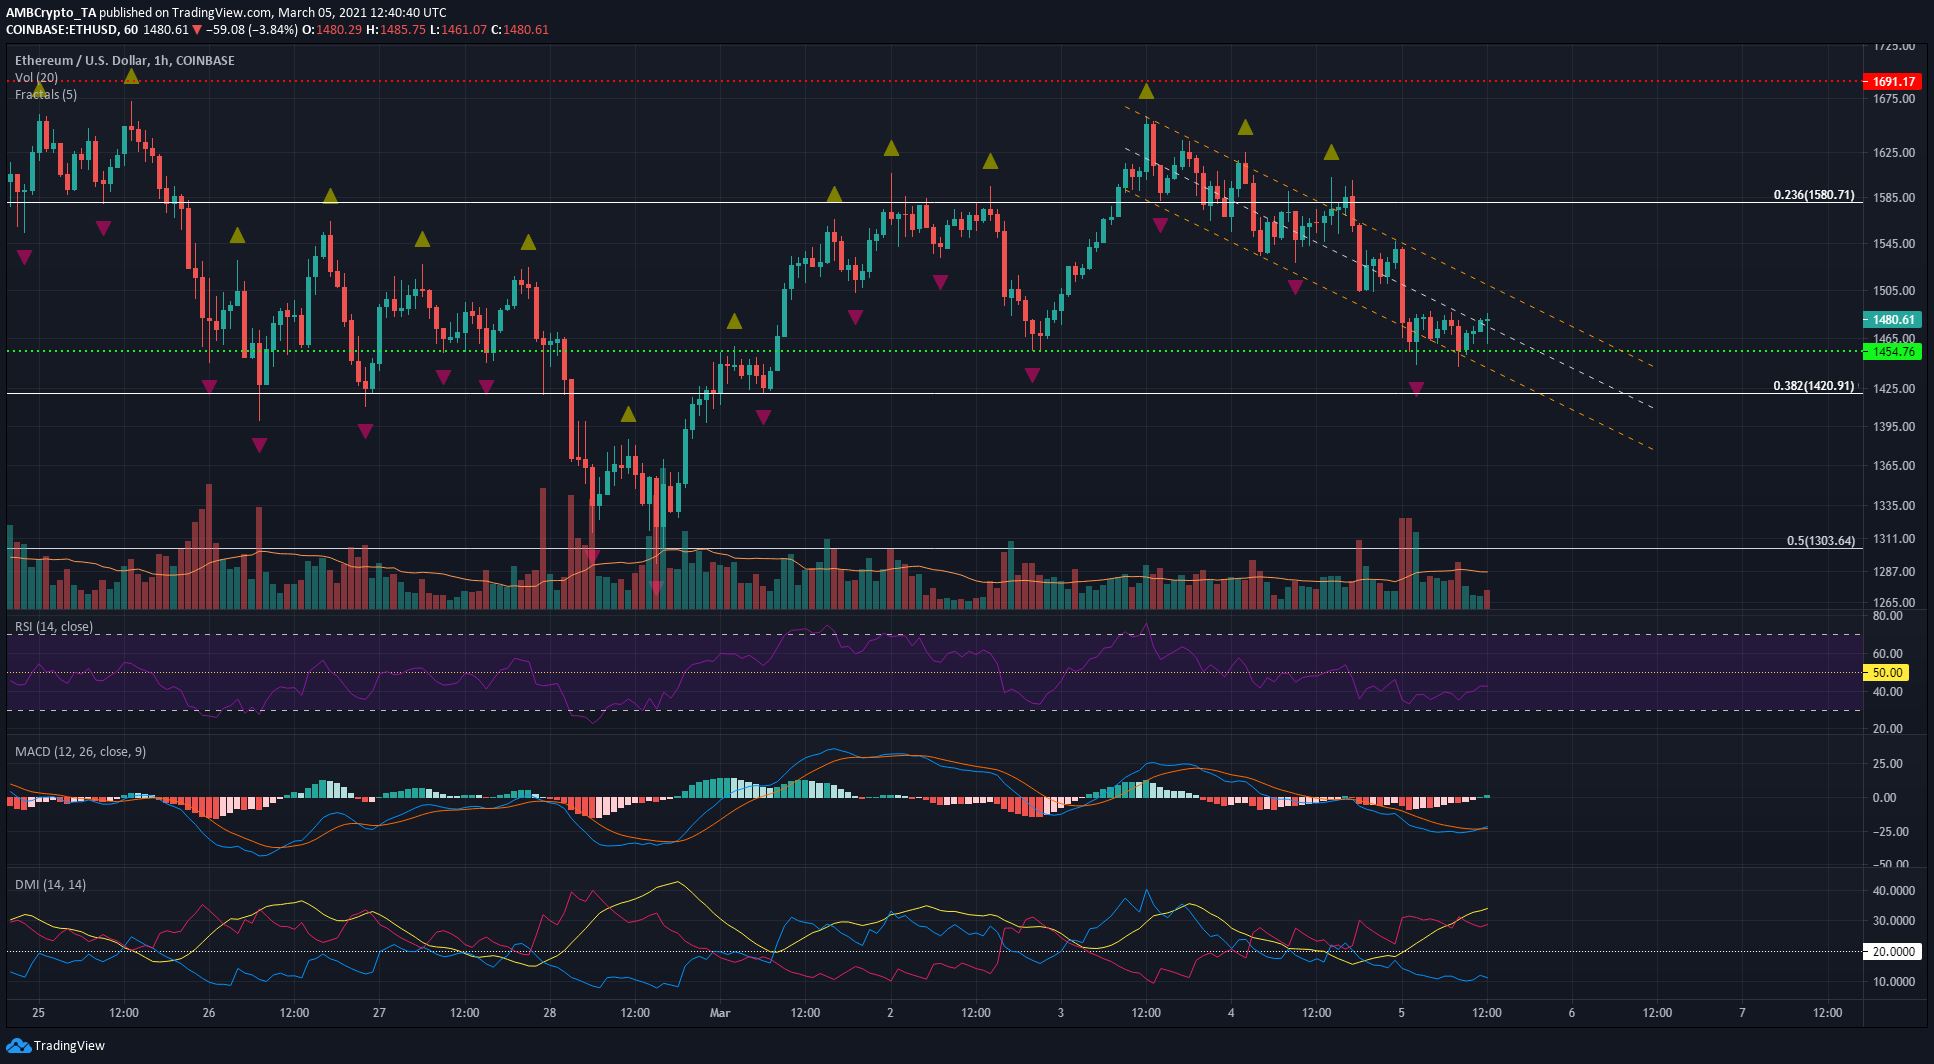
The past few days saw ETH scale the heights of $1,600 after a drop as far south as $1,335, but another dip back under $1,580 was underway, at press time. The $1,580 and $1,420-levels represent the 23.6% and 38.2% retracement levels for Ether’s move from $905 to $1877.
The altcoin’s price was trading within a descending channel pattern. At the time of writing, it was trading above the mid-point of the channel, and the $1,500-area could be used to open short positions with tight stop-losses.
Reasoning
The upper boundary of the channel is likely to be tested if ETH closes a trading session above the mid-point of the channel, and the psychological $1,500-level could provide some confluence over the next few hours for this move.
However, technical indicators remained bearish. The Directional Movement Index noted a soaring ADX (yellow) and a -DI (pink) above the 20 value to denote a strong bearish trend recently. The MACD was under zero and the RSI stood at 42 to show that bears were still in play.
Finally, the fractals highlighted that over the past two weeks, $1,450 has been tested multiple times as a support, as well as resistance, making it a prominent level of interest in the short-term.
Conclusion
While Ethereum was bearish in the short-term, the $1420-$1450 area has served well as support in the past. A drop below the same, and a subsequent retest of this area, will be confirmation of further losses to $1320. A breakout above the descending channel would be a strong short-term bullish development, although trading volume must also corroborate to confirm a move towards $1580-$1600 for ETH.


