Ethereum Price Analysis: 29 January

Disclaimer: The findings of the following analysis are the sole opinions of the writer and should not be taken as investment advice
Ethereum was valued at around $1,300 at press time, after dropping by 11% from its all-time high [ATH] of $1,476 on 25 January. Interestingly, the world’s largest altcoin might be due for more downward swings, especially in light of the bearish indicators on the larger timeframes [LTF].
This upcoming drop could push ETH down by 8% to 10% to its immediate support. A breach of this level would be an opportunity for the market’s bears to push the price to triple digits.
Ethereum 1-day chart
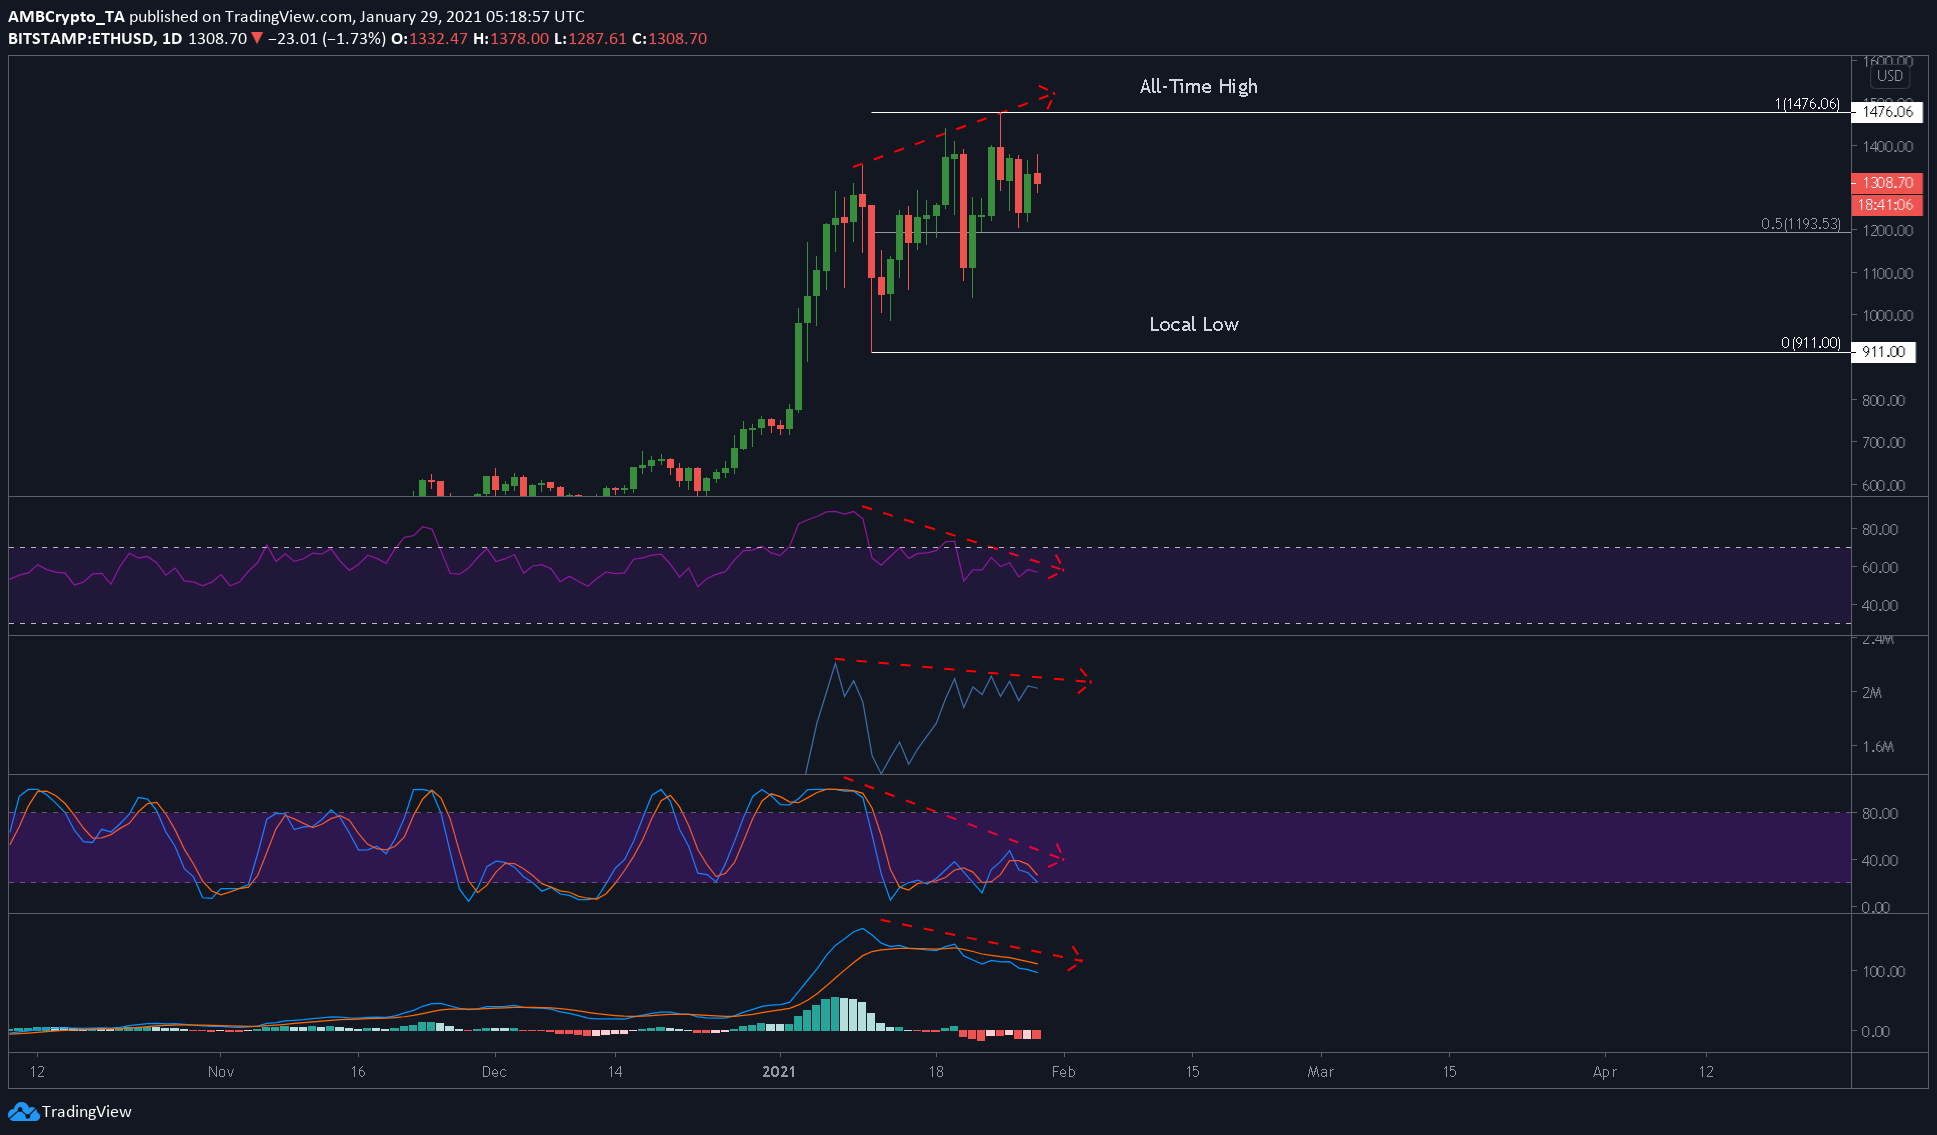
The 1-day chart for Ethereum underlined its price development, with the same highlighting ETH hitting the ATH at $1,476. An observation of ETH’s charts revealed that the run that led to ETH’s latest highs was overextended and showed no volume or momentum backing it. In fact, a bearish divergence was seen against the price among multiple indicators like the RSI, Stochastic RSI, and even the MACD indicator.
As a result, the price dropped by approximately 11% to the level where it traded, at press time. Moreover, this drop could continue towards the 0.5-Fibonacci level, as seen in the chart below, a development that would mean another 8%-10% drop for the smart contracts platform.
It should also be noted that a bounce from the 0.5-Fibonacci level seemed like a possibility that cannot be dismissed.
Ethereum 4-hour chart
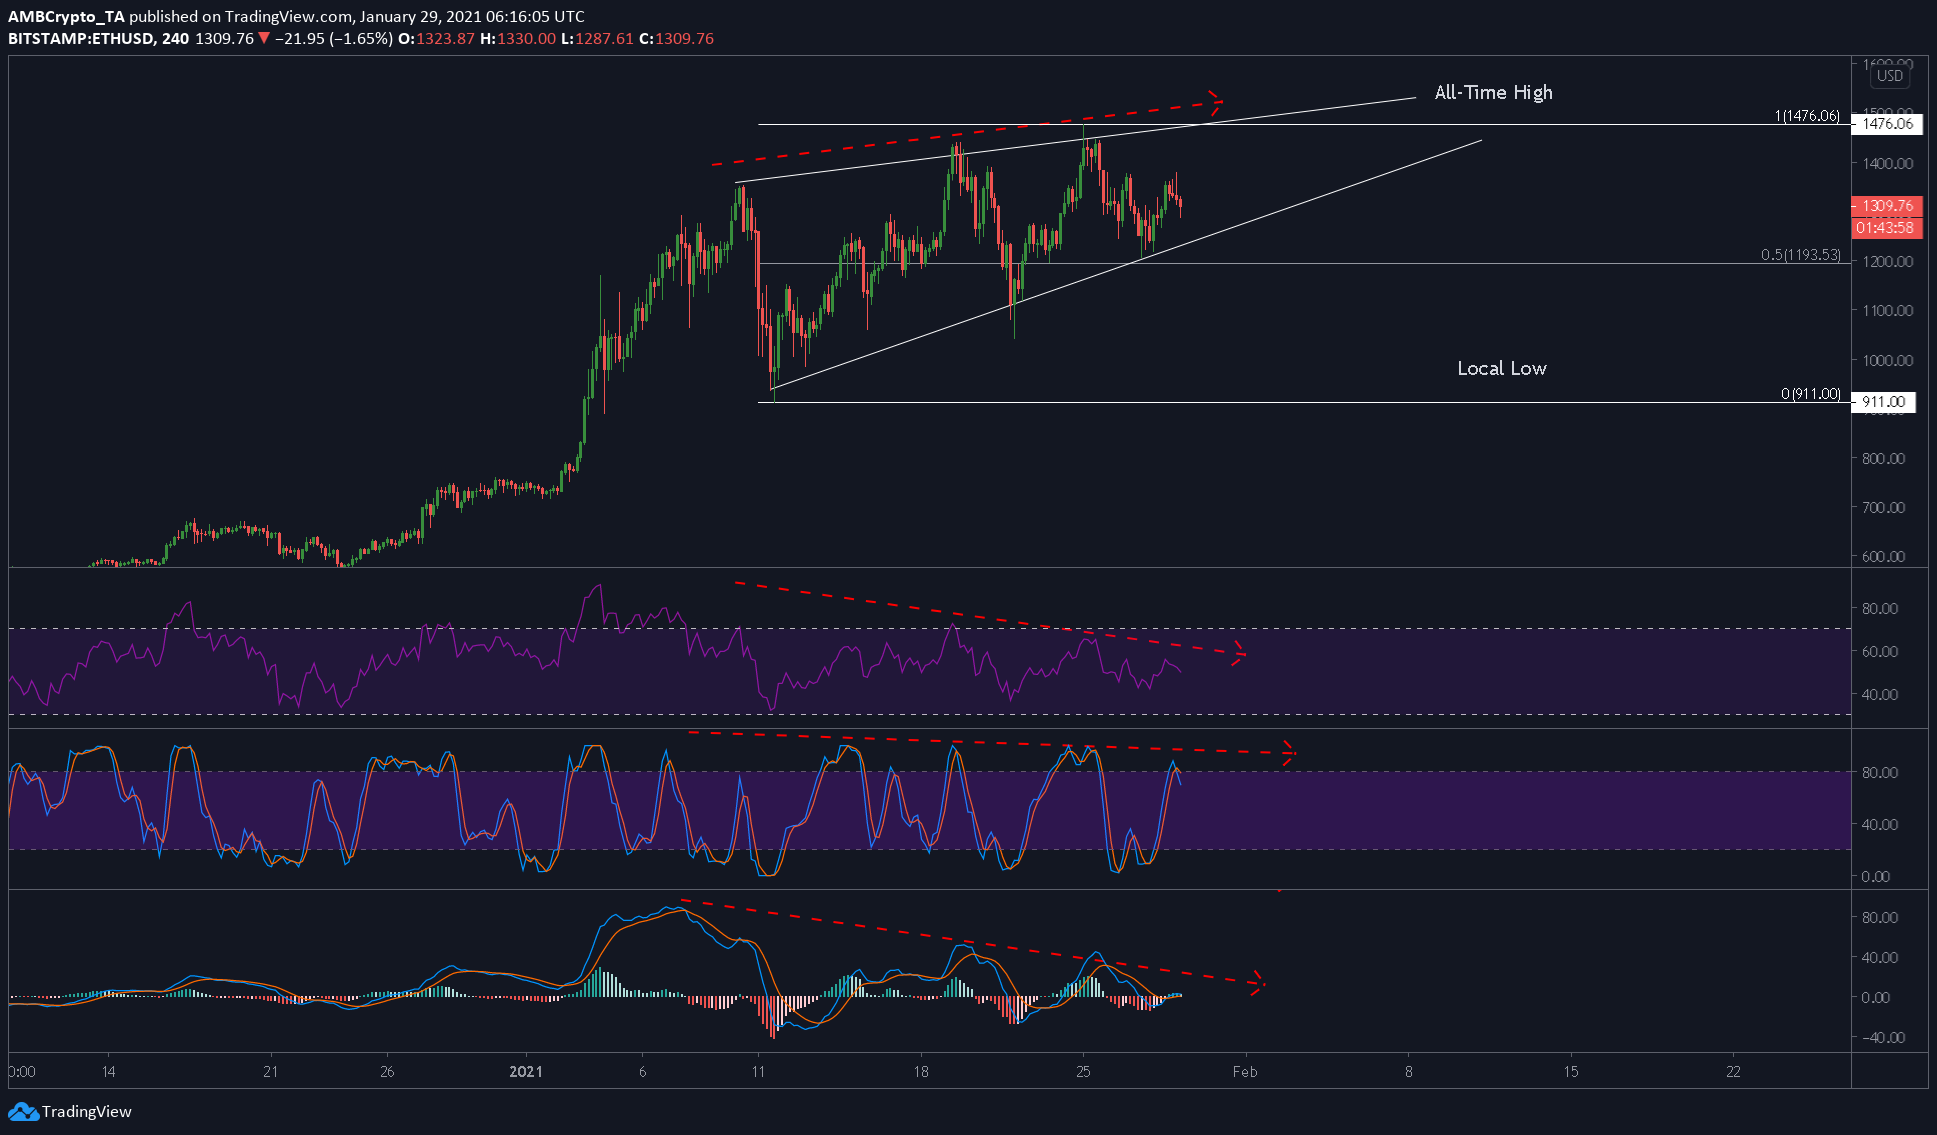
The 4-hour chart presented a much clearer picture of what’s happening with the price. The development of a rising wedge, a bearish pattern, adds more fuel to the existing bearish divergence. A breakout from this pattern theoretically would suggest a target of $911. However, due to the presence of strong support levels from $1,050 to $1,100, this drop might be truncated.
Moreover, the RSI indicator was in a pullback from the overbought zone, highlighting a fall in buying momentum and a hike in selling momentum. Further, the Stochastic RSI printed a bearish crossover in the overbought zone, one mirroring the RSI’s increasing sell momentum signal. The MACD indicator also suggested that a drop below zero could be possible soon due to the formation of a bearish crossover.
Conclusion
With bearish divergence staying strong on both the 1-day and the 4-hour timeframes, Ethereum might have to drop to the 0.5-Fibonacci level at $1,200 and even lower into the triple digits, if the sell-off continues. Adding more credibility to this drop would be Ethereum’s correlation with Bitcoin, with the latter seeing some bearish patterns emerge too, despite an unexpected hike fueled by Elon Musk’s profile update.


