
Ethereum price hit a new ATH of $1476 on Monday after recently testing the previous ATH a few days ago. While ETH’s resurgence is bullish in the short-term it is yet to determine how the long-term outlook will evolve. At press time, there are conflicting long-term outlooks but the short-term scenario seems bearish for the smart contracts platform.
Trading at $1423 at press time, Ethereum price stands above an important area of resistance; failure to conquer this resistance puts bears in control.
Ethereum 6-hour chart
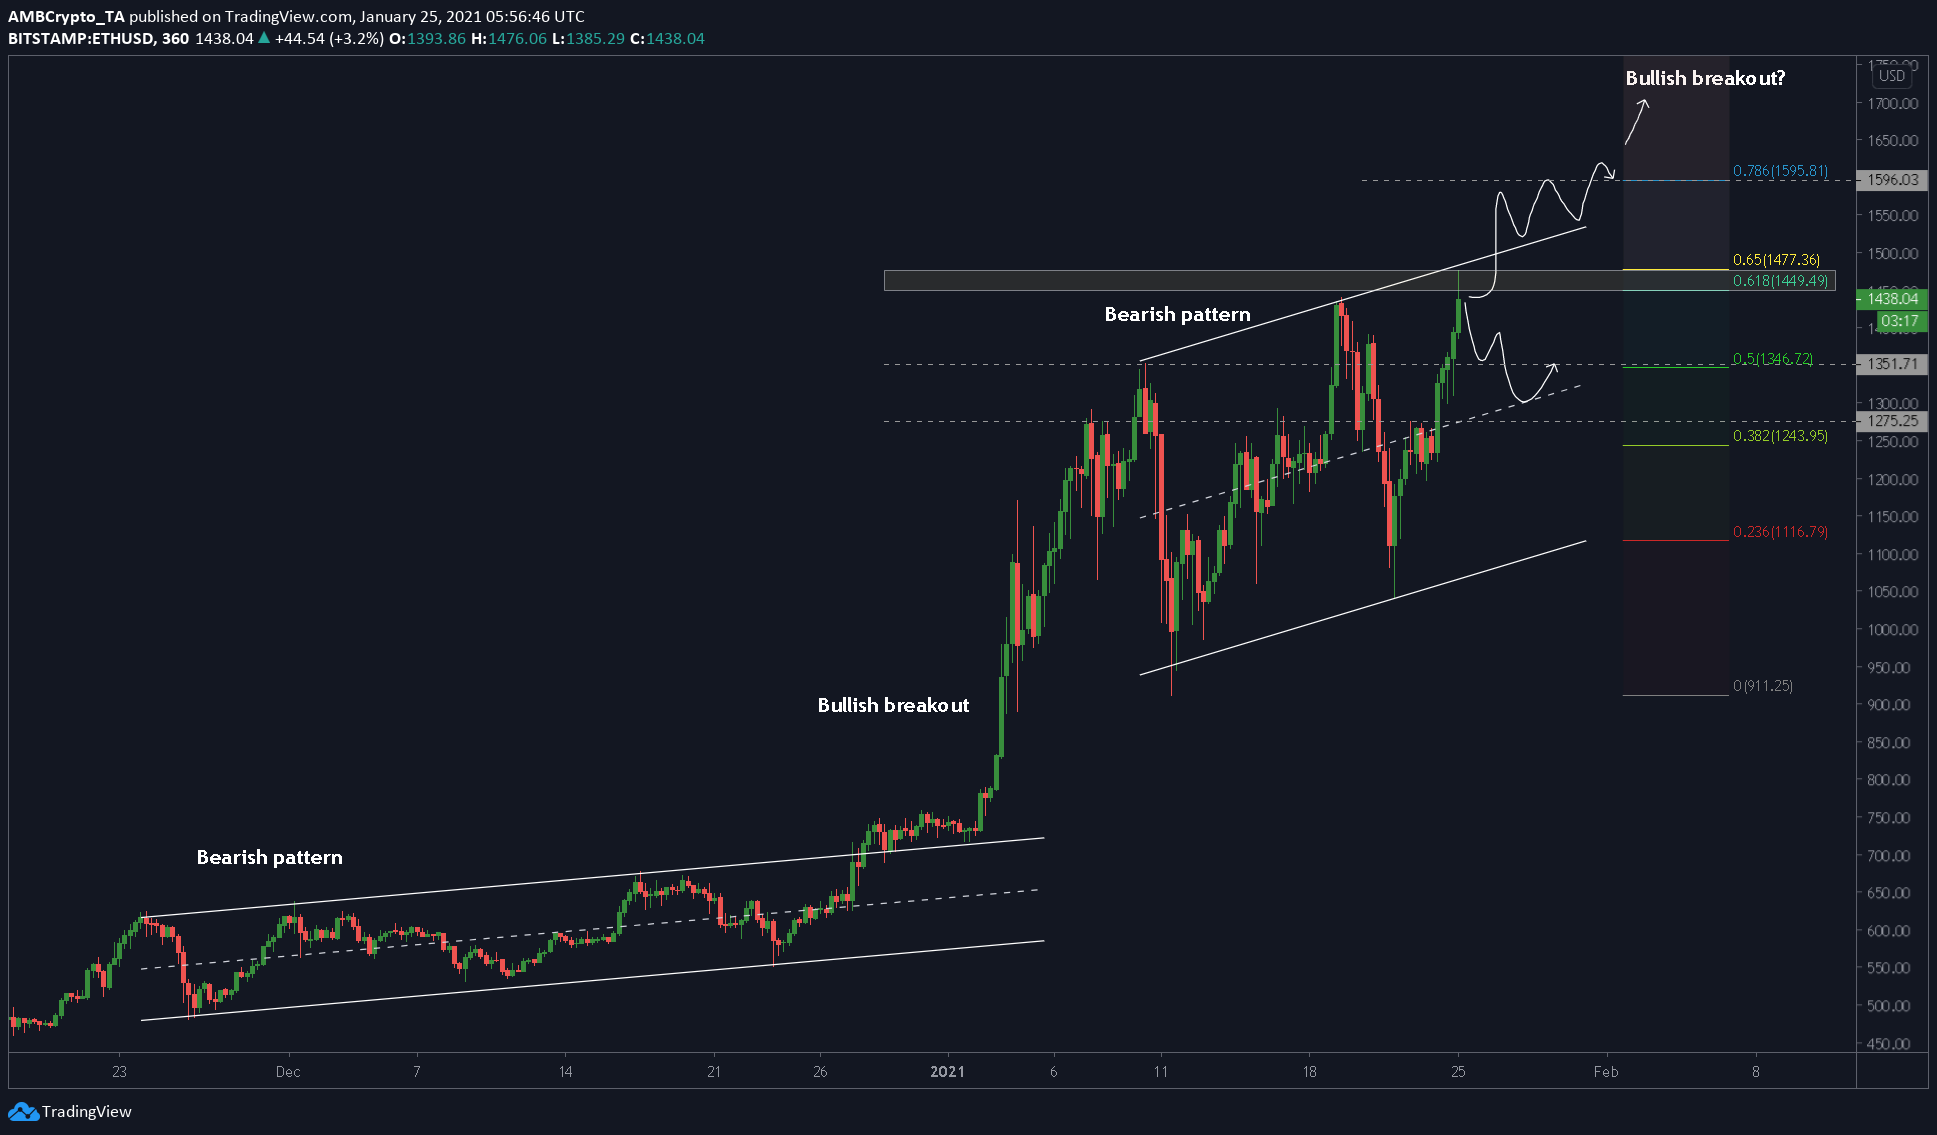
Source: ETHUSD TradingView
The Ethereum price shows an ascending parallel channel that theoretically calls for a bearish breakout. However, considering the inflow of capital and institutional investment, this is a bull cycle and a bearish breakout seems unlikely. If anything, the breakout from the recent ascending parallel channel in late December is the proof of the bull run.
Hence, this time around, ETH’s price is expected to break higher. At press time, Ethereum’s price is testing the upper trendline of the parallel channel and has to decide if it is going to head higher or get rejected and head lower. If the price gets rejected or forms a lower high on the OBV, then there will be a bearish divergence between the price and OBV. This divergence further suggests a drop for the smart-contracts platform.
Moreover, the Stochastic RSI indicator also suggests that the price is overbought and is preparing for a potential downtrend due to the formation of a bearish crossover.
The RSI indicator hasn’t hit the overbought zone yet but shows signs of diminished buyers – indicating a retracement is likely. As mentioned earlier, the OBV indicator shows that buy volume is reducing indicating a bearish divergence and hence, a pullback.
Conclusion
A pullback at the upper trendline will most likely push the price towards the middle-line of the parallel channel at $1300, which would mean a drop of 7 to 10%. The price is also likely to bounce off the support at $1346, which coincides with the 50% Fibonacci level.
In addition to the indicators, the Fibonacci extension tool shows that there is a golden pocket area above the current price, which is a strong area of support/resistance. Hence, a trend higher for the price here would require strong buying pressure.