Ethereum: Rebound from this level can help bears retest $1,684

Disclaimer: The information presented does not constitute financial, investment, trading, or other types of advice and is solely the writer’s opinion.
Over the last two days, Ethereum [ETH] recouped its bullish forces after witnessing a morning star candlestick setup from its 200 EMA (green). The string of subsequent green candlesticks has aided the alt to close above the Point of Control (POC, red).
The recovery efforts deployed by the buyers have helped ETH test the seven-week trendline resistance (white, dashed) in the four-hour timeframe.
Should this resistance stand sturdy, it could pose some recovery hurdles in the progression phase before a likely revival. At press time, ETH traded at $1,722.2, up by 5.66% in the last 24 hours.
ETH 4-hour Chart
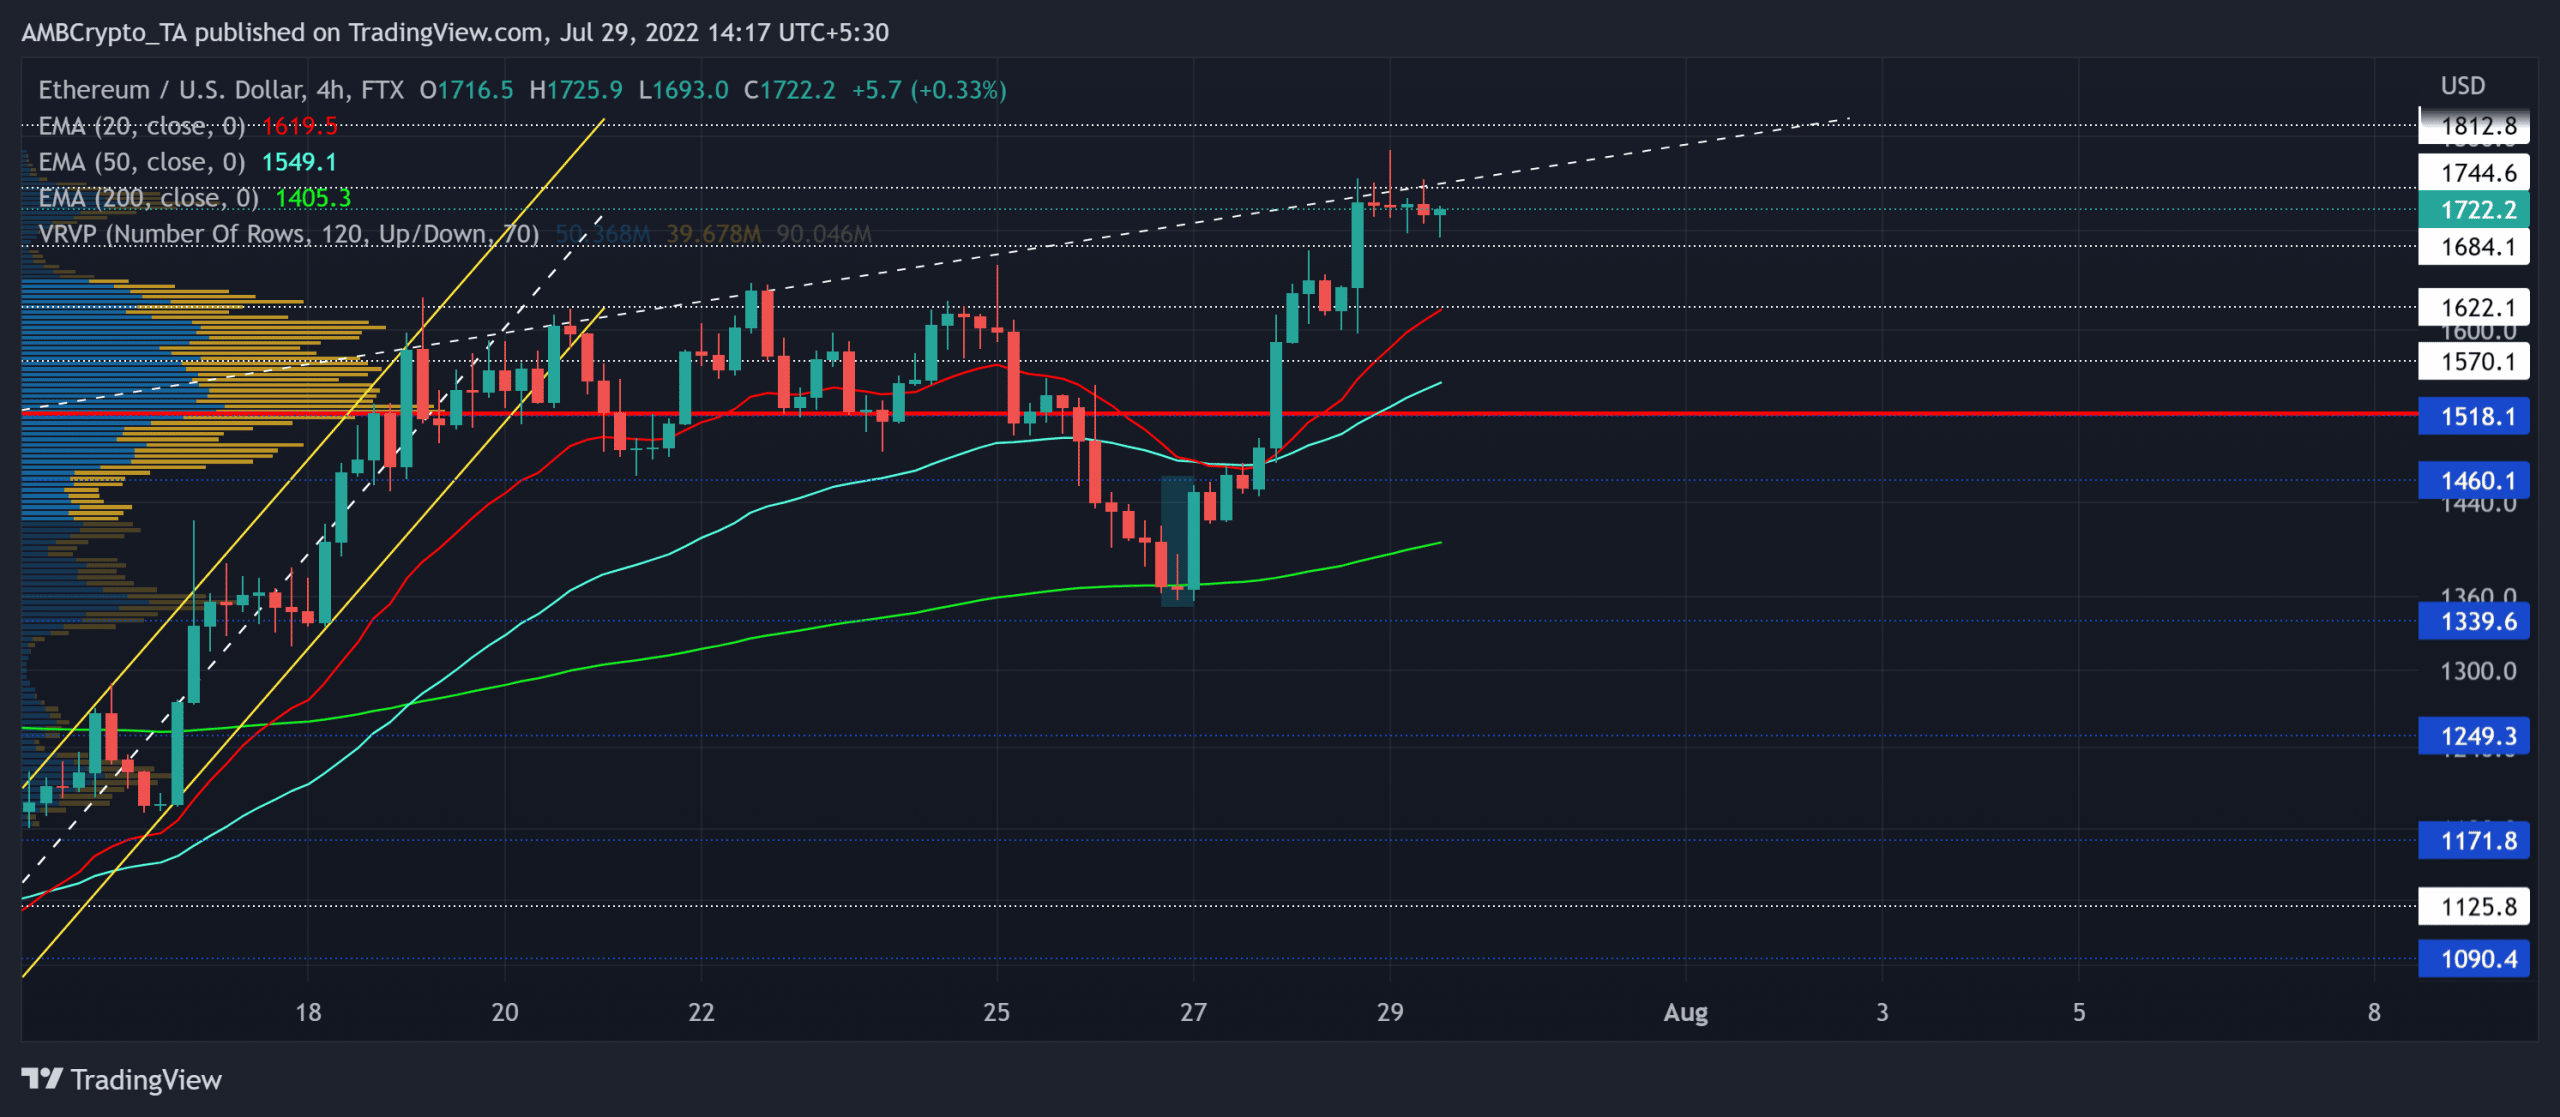
ETH’s growth in the last two weeks has revealed a robust buying edge while the price found a position above the 20/50/200 EMA. The alt’s jump above the POC resulted in the recent bullish volatile break.
After falling toward its multi-yearly-lows in June, the buyers ensured the $1,037 mark by propelling multiple rallies. As a result, the recent buying comeback entailed the alt’s growth toward its monthly high on 29 July.
But with the bears posing hurdles near the trendline resistance, ETH saw a bearish hammer that hinted at a strong rejection of higher prices. Meanwhile, the 20/5/200 EMA kept looking north to depict an increasing buying pressure.
A rebound from the $1,744 level can help the bears retest the $1,684-$1,622 range in the coming sessions. On the flip side, any eventual break above the trendline resistance could pave a path for a test of the $1,812.
Rationale
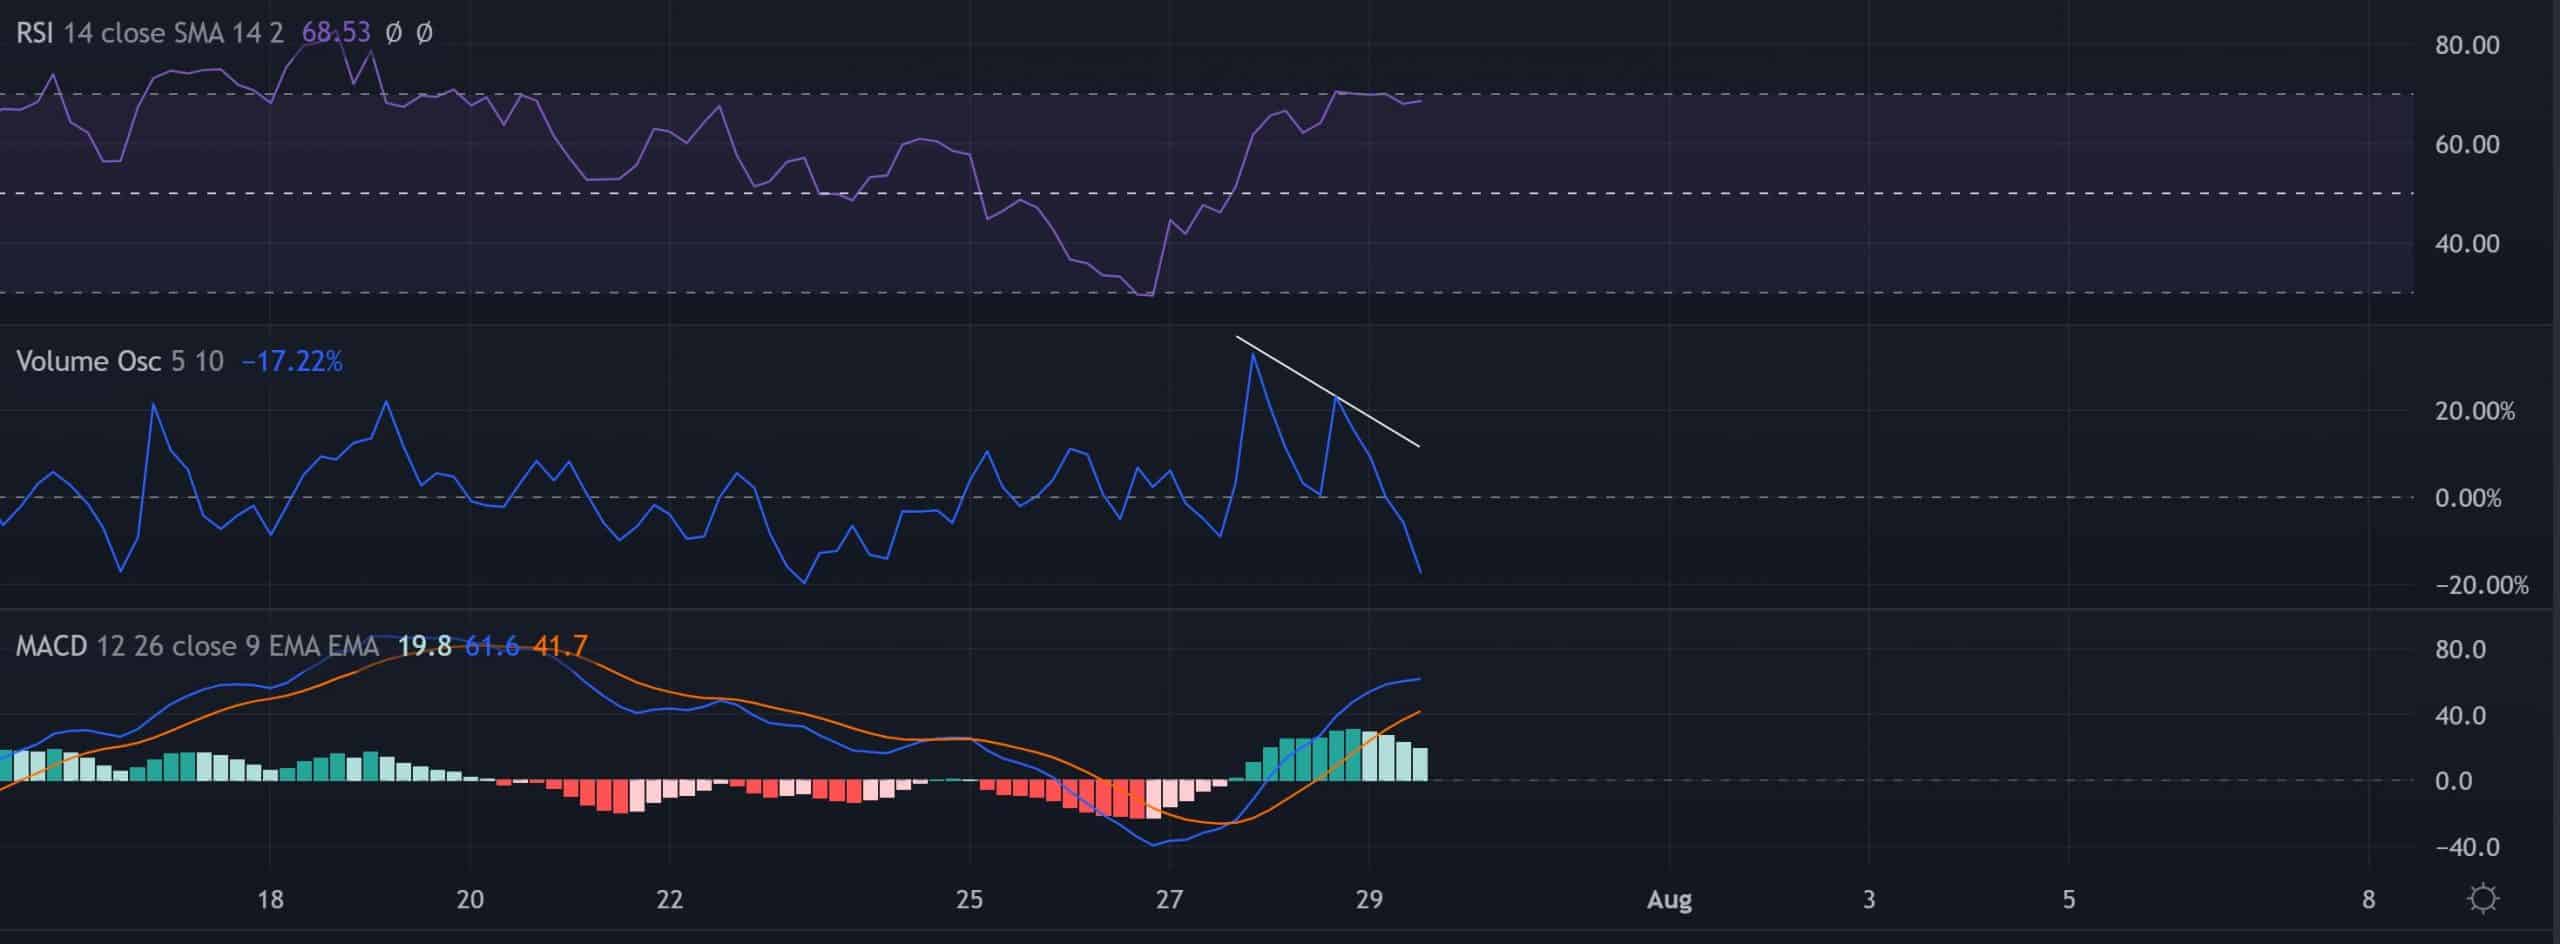
The Relative Strength Index (RSI) hovered at the brink of the overbought position at press time. Any reversal from this level can affirm near-term ease in buying power.
Also, the Volume Oscillator (VO) marked lower peaks during the recent gains and saw a bearish divergence with price. Nevertheless, the MACD lines kept depicting a strong buying momentum.
Conclusion
Owing to the trendline resistance alongside the lower peaks of the VO, ETH could see a near-term slowdown before picking itself up again. A close above the $1,744 mark could confirm the upside trigger. The targets would remain the same as discussed above.
Finally, investors/traders need to watch out for Bitcoin [BTC]’s movement. This is because ETH shares a staggering 95% 30-day correlation with the king coin.


