Ethereum: Similarities with 2018’s market structure might foreshadow this ‘worst-case scenario’

Market sentiment across the month of August has been largely bullish. Especially since some crypto-assets recovered significantly to touch their ATH levels once again. Ethereum hasn’t been one of those assets, however. Even so, maintaining a consolidating range above $3000 since the beginning of August speaks volumes.
Right now, Ethereum is holding a position near the $3200-mark. Over the past few days, however, some bearish concerns had begun to surface on the charts.
Now, the trend looks a little shaky over the short term. Ergo, in this article, we will try and analyze the worst-case scenario for Ethereum, one which has a bit of historical backing.
A Dead-Cat Bounce on the weekly?
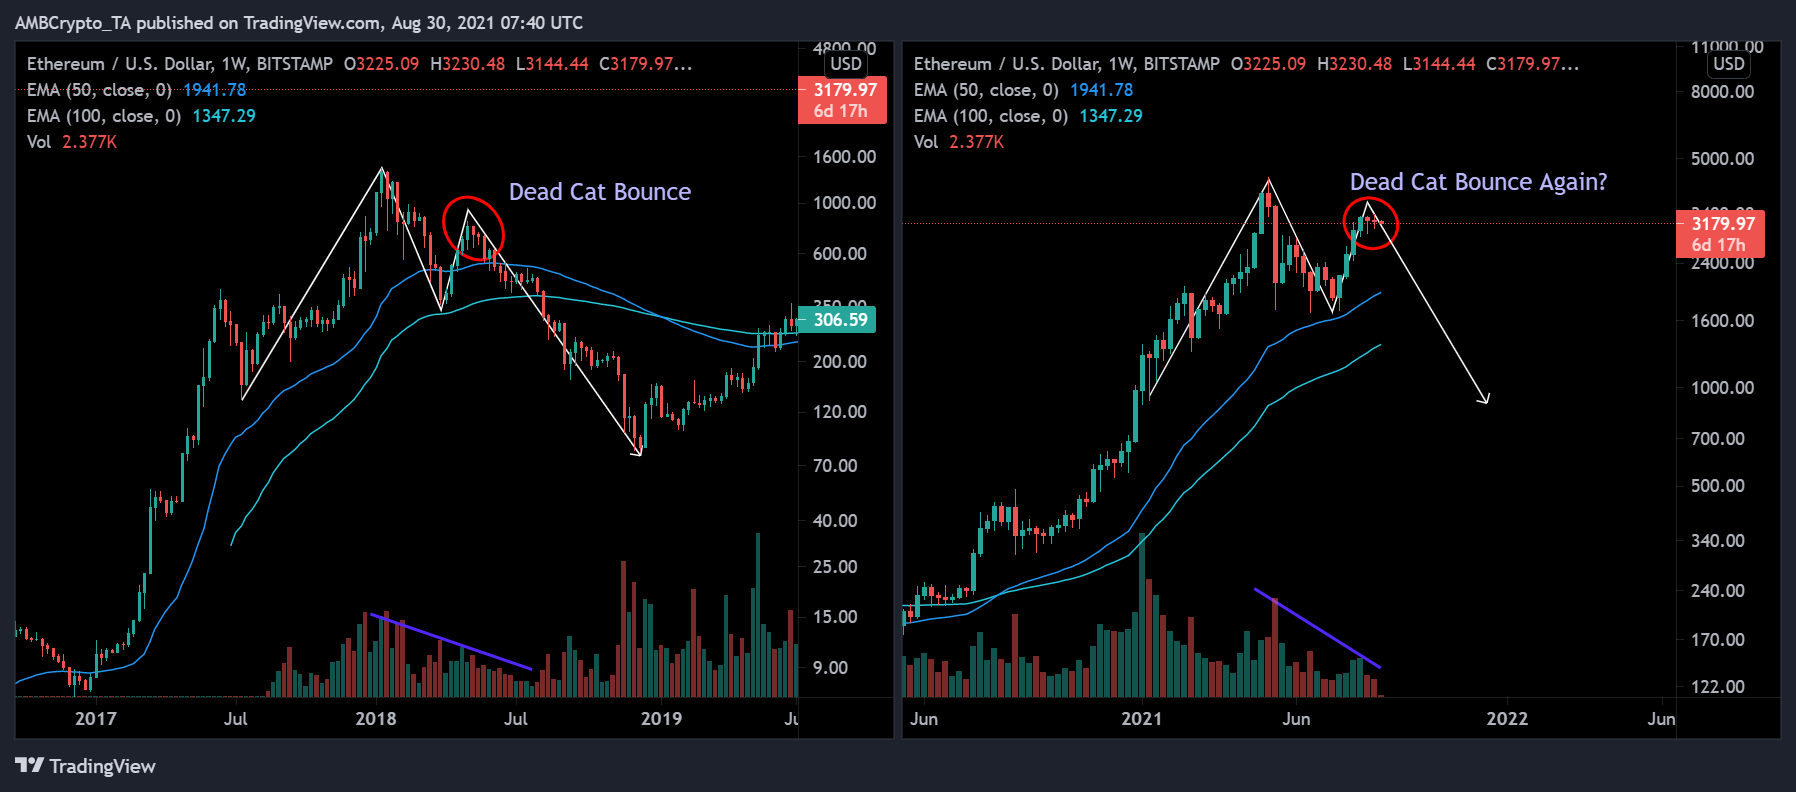
Markets fractals are considered to be an essential part of technical analysis, with the same looking at the prospect of pattern repetition. Simply put, an asset may tend to follow a direction that was identified well in the past.
Consider the case of Ethereum, for instance. At the moment, its weekly chart seems to be picturing similarities with its 2018 structure.
As can be seen from the attached chart, Ether’s weekly chart is currently tracing a strong dead-cat bounce fractal. A dead-cat bounce is a market condition where the price momentarily rallies back after a correction. Following the said hike, the market continues to drop and forms new lower lows on the chart.
At the moment, there are many similarities between Ethereum in 2018 and 2021. In 2018, before the price went down, it consolidated sharply for 3 weeks straight. A similar situation is unfolding right now, with ETH’s value moving sideways since 7 August.
Receding trading volumes across both time periods is yet another similarity. Ergo, if the price does move south following corrections, the possibility of a new low under $2000 might be on the cards for the altcoin.
Ethereum active addresses refuse participation?
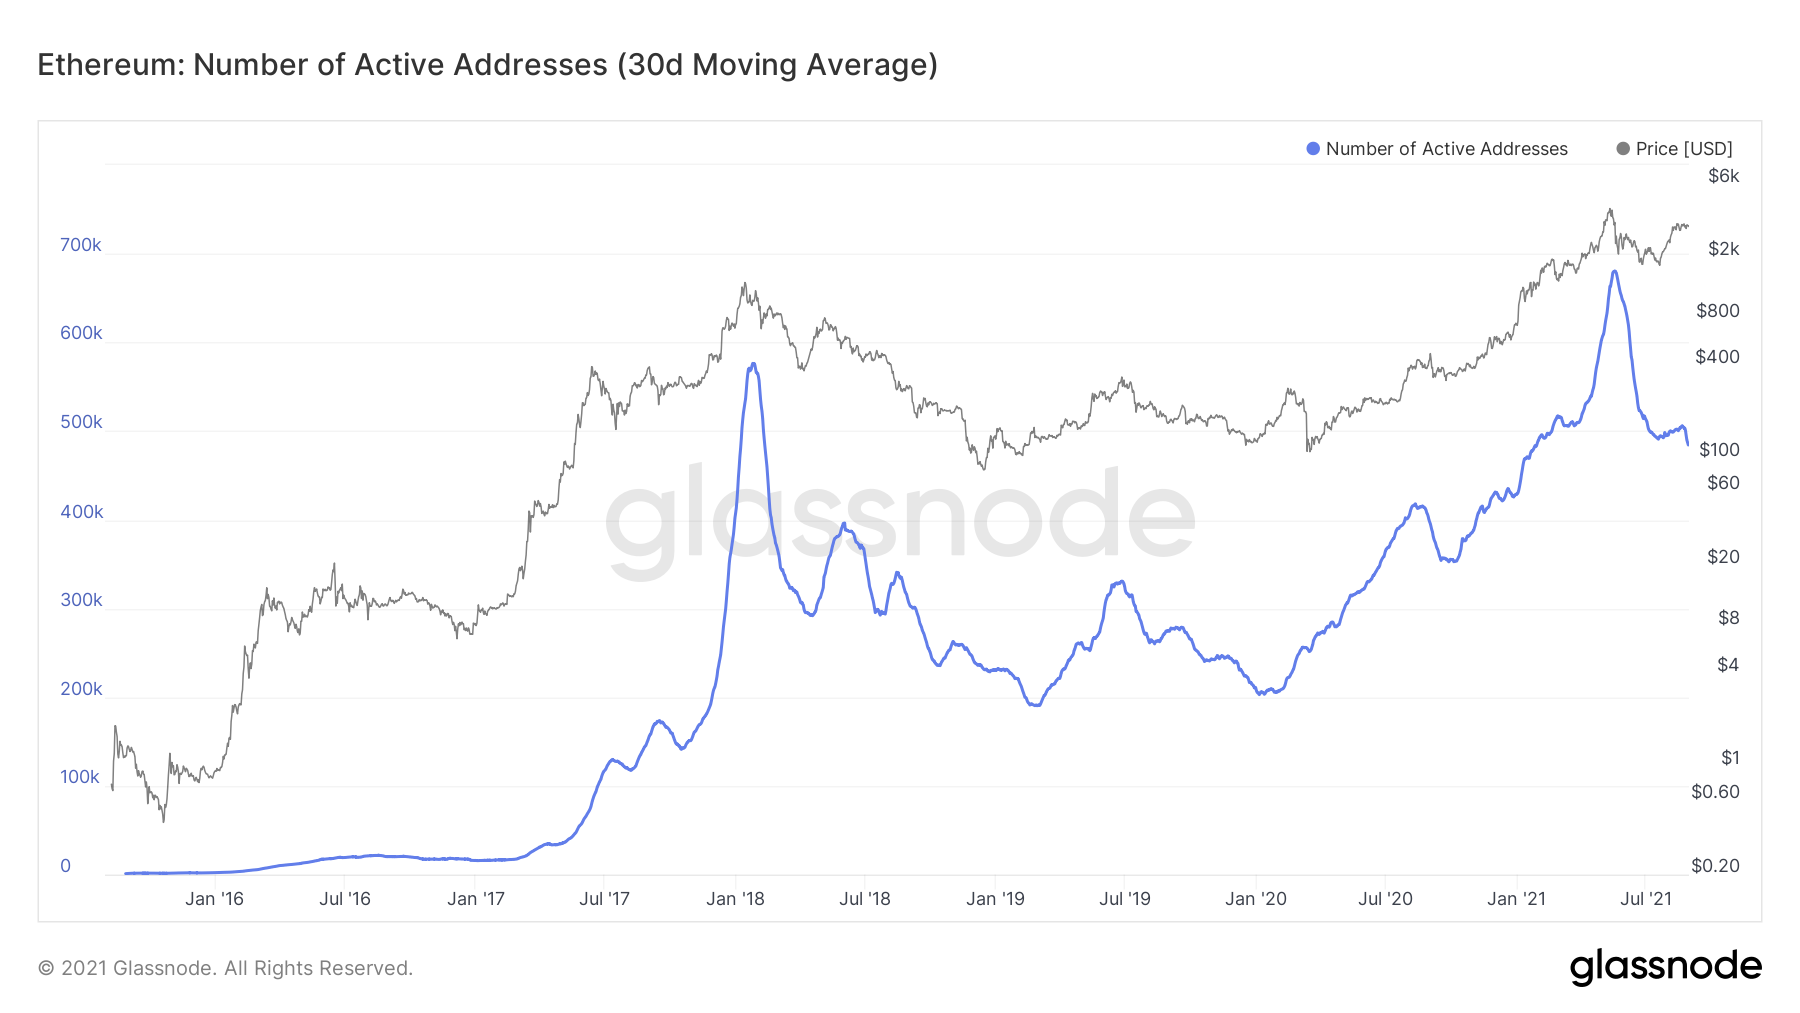
From an on-chain perspective, most assets have seen a lack of activity. This was the story for Ethereum too. After peaking during its rally, active addresses have largely dropped on the charts. The “recovery” hasn’t prompted a spike in active addresses either.
What this suggests is that the ongoing rally is dependent on a few investors. Now, while it is still early days to call an outrightly bearish market for Ethereum, the signs are clearly there.
Over the next couple of weeks, if Ethereum breaks above $3400, the fractal pattern will be disrupted. This disruption could be the bullish trigger ETH needs. If that doesn’t happen, ETH might just follow the norms set by the market in 2018.