
Will Worldcoin break above $1.40, reach $2? Mapping…
Analysis

Ethereum slides rapidly as structure shifts bearish, could more losses follow
Posted:
Journalist

Disclaimer: The findings of the following analysis are the sole opinions of the writer and should not be considered investment advice
- Ethereum saw a large selling volume and shifted the lower timeframe structure to bearish
- Technical indicators and futures traders both showed further losses were possible
At the time of writing, the previous 24 hours had seen $357 million worth of positions liquidated across major crypto exchanges. Ethereum [ETH] saw $90 million and shed nearly 9% of its value in this period.
Here’s AMBCrypto’s price prediction for Ethereum [ETH] for 2022-2023
Bitcoin fell below the $20k level and multiple altcoins posted losses in double-digit percentages in the twelve hours preceding the time of writing.
$1446 could be a crucial level for the bulls to defend in the coming hours
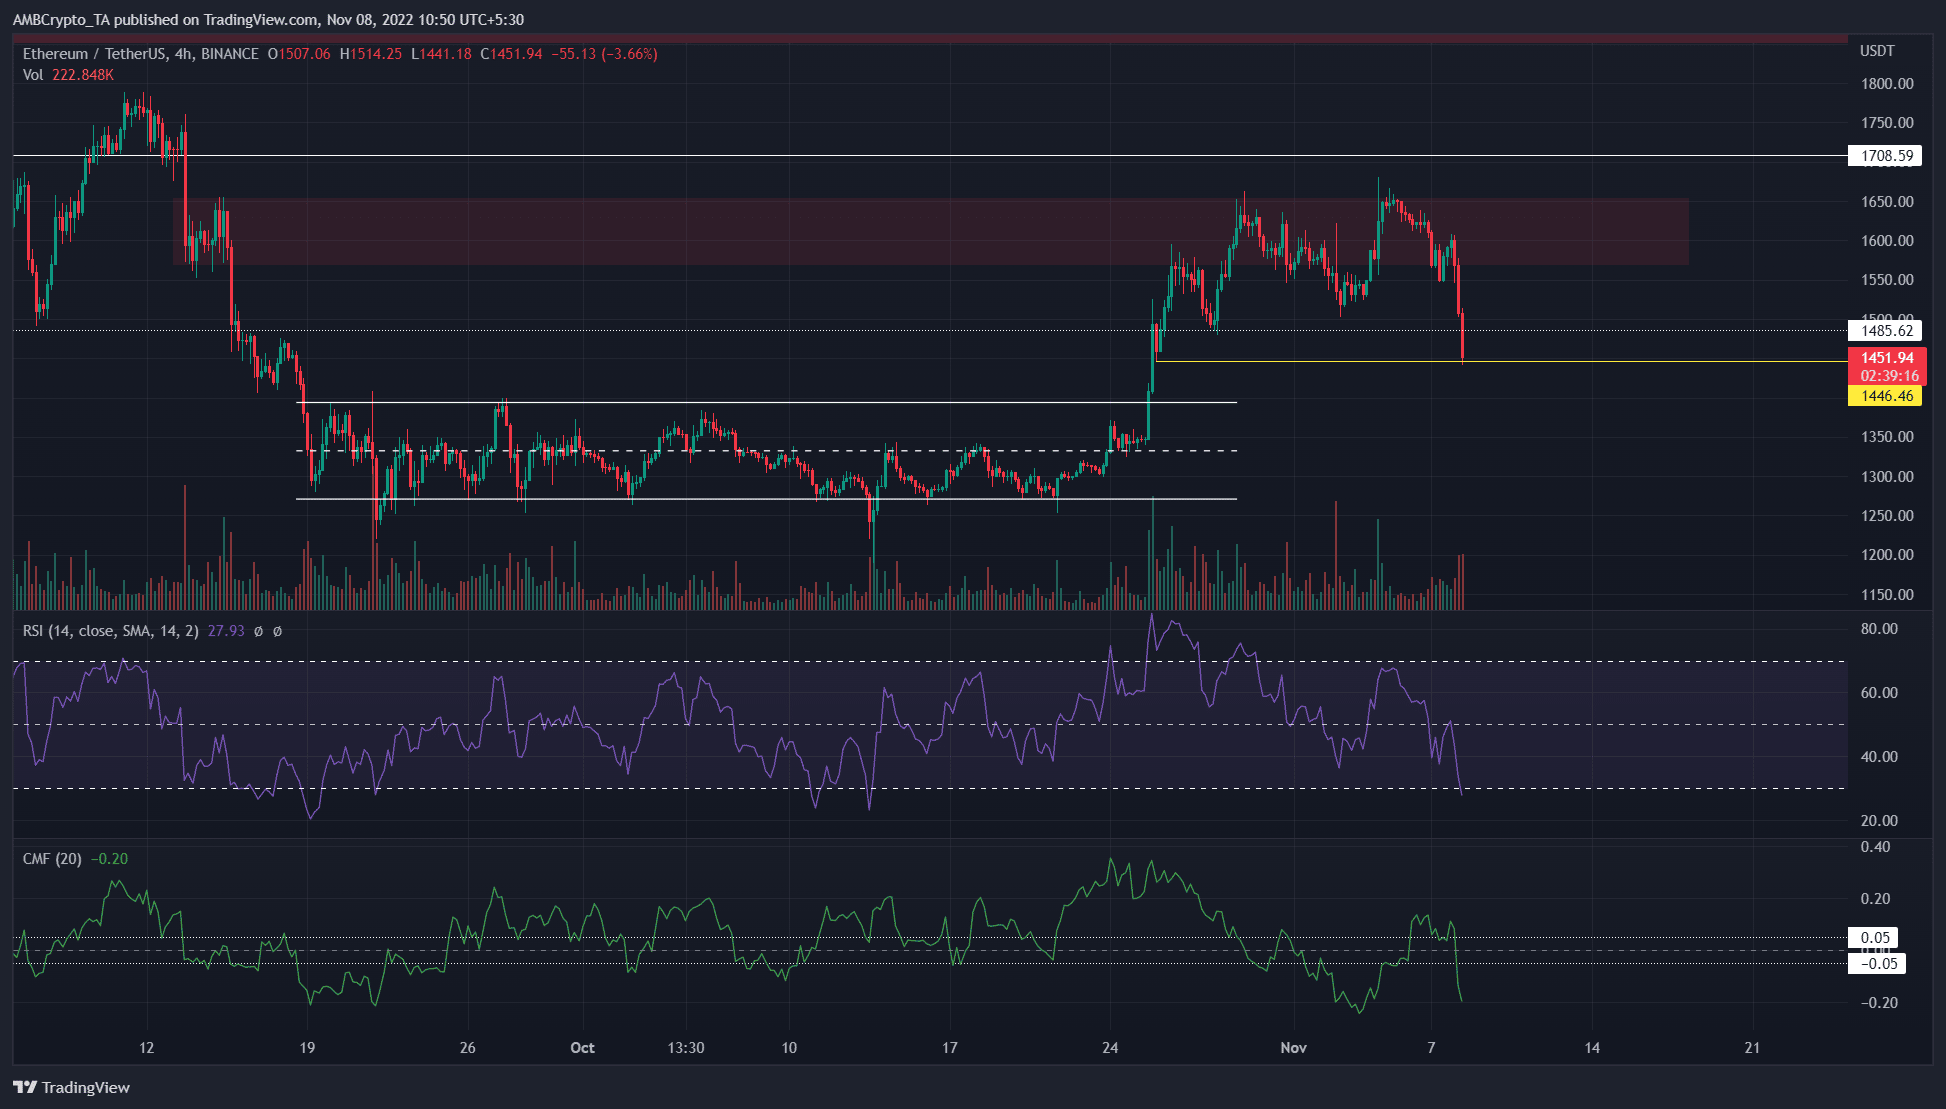
Source: ETH/USDT on TradingView
The two-hour chart showed ETH breaking its structure from bullish to bearish in the past few days. Subsequently, lower lows were formed.
On the daily timeframe, a bearish order block was spotted in the vicinity of $1,650. Marked in red, this region posed substantial resistance to Ethereum over the past year.
ETH was simply unable to push above $1,650. A recent article highlighted how a push above $1,650 could see ETH surge higher. This did not materialize, as a rejection near the $1,650 mark occurred instead. On the lower timeframe, another belt of support lay at $1,446-$1,495.
For ETH, an hourly session close below $1,446 could fuel the bearish sentiment. On the other hand, a defense of the bullish order block that extended up to $1,495 would be a sign that bulls had begun to buy in earnest.
The Relative Strength Index (RSI) retested neutral 50 as resistance the previous day and showed strong bearish momentum. The Chaikin Money Flow (CMF) also fell below -0.05 to highlight heavy capital flow out of the market in recent hours.
Funding rate shift shows bearish sentiment dominance in recent hours
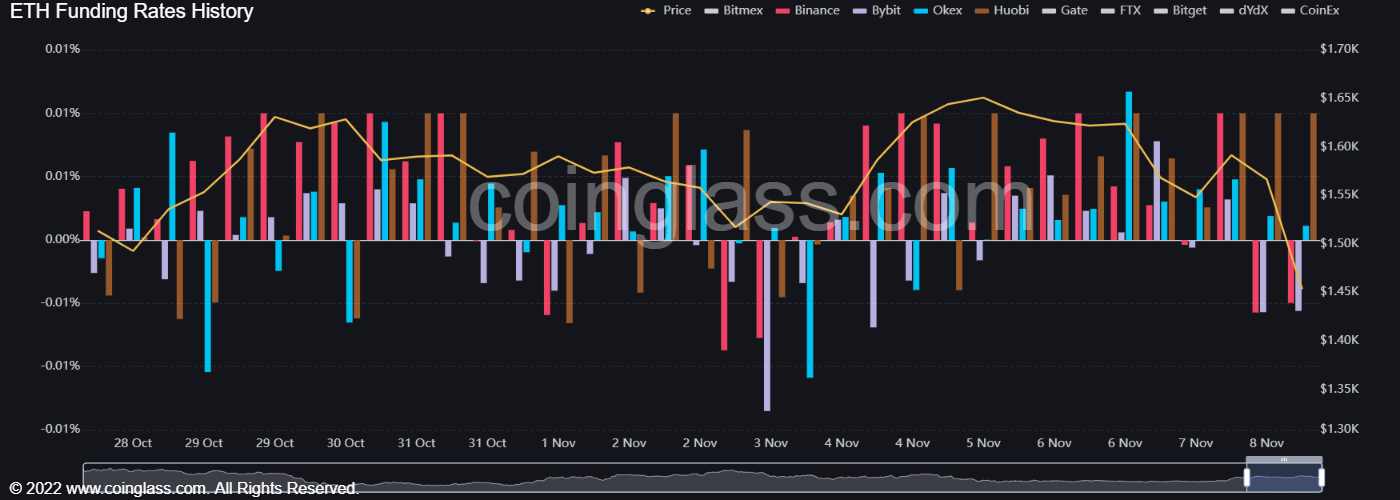
Source: Coinglass
The trading day of 7 November saw the funding rate of the Ethereum switch from positive to negative on Binance and Bybit. This showed that, on some of the major exchanges at least, the sentiment favored the bears. Alongside the fall in price, the Open Interest behind Ethereum also fell.
Furthermore, technical findings showed that $1,446-$1,495 would be an important zone of support for Ethereum over the next day or two. A session close below $1,450 could see ETH descend to $1,365.


