Ethereum, Solana, Fantom Price Analysis: 25 December

While the bulls endeavored to skew the sentiment in their favor, the bears refrained from giving up their edge as the crypto fear and greed index stood below 40.
Ethereum poked $4,100 while Solana jumped above the crucial $192-level. Fantom saw staggering gains after a long-term trend reversal.
Ethereum (ETH)
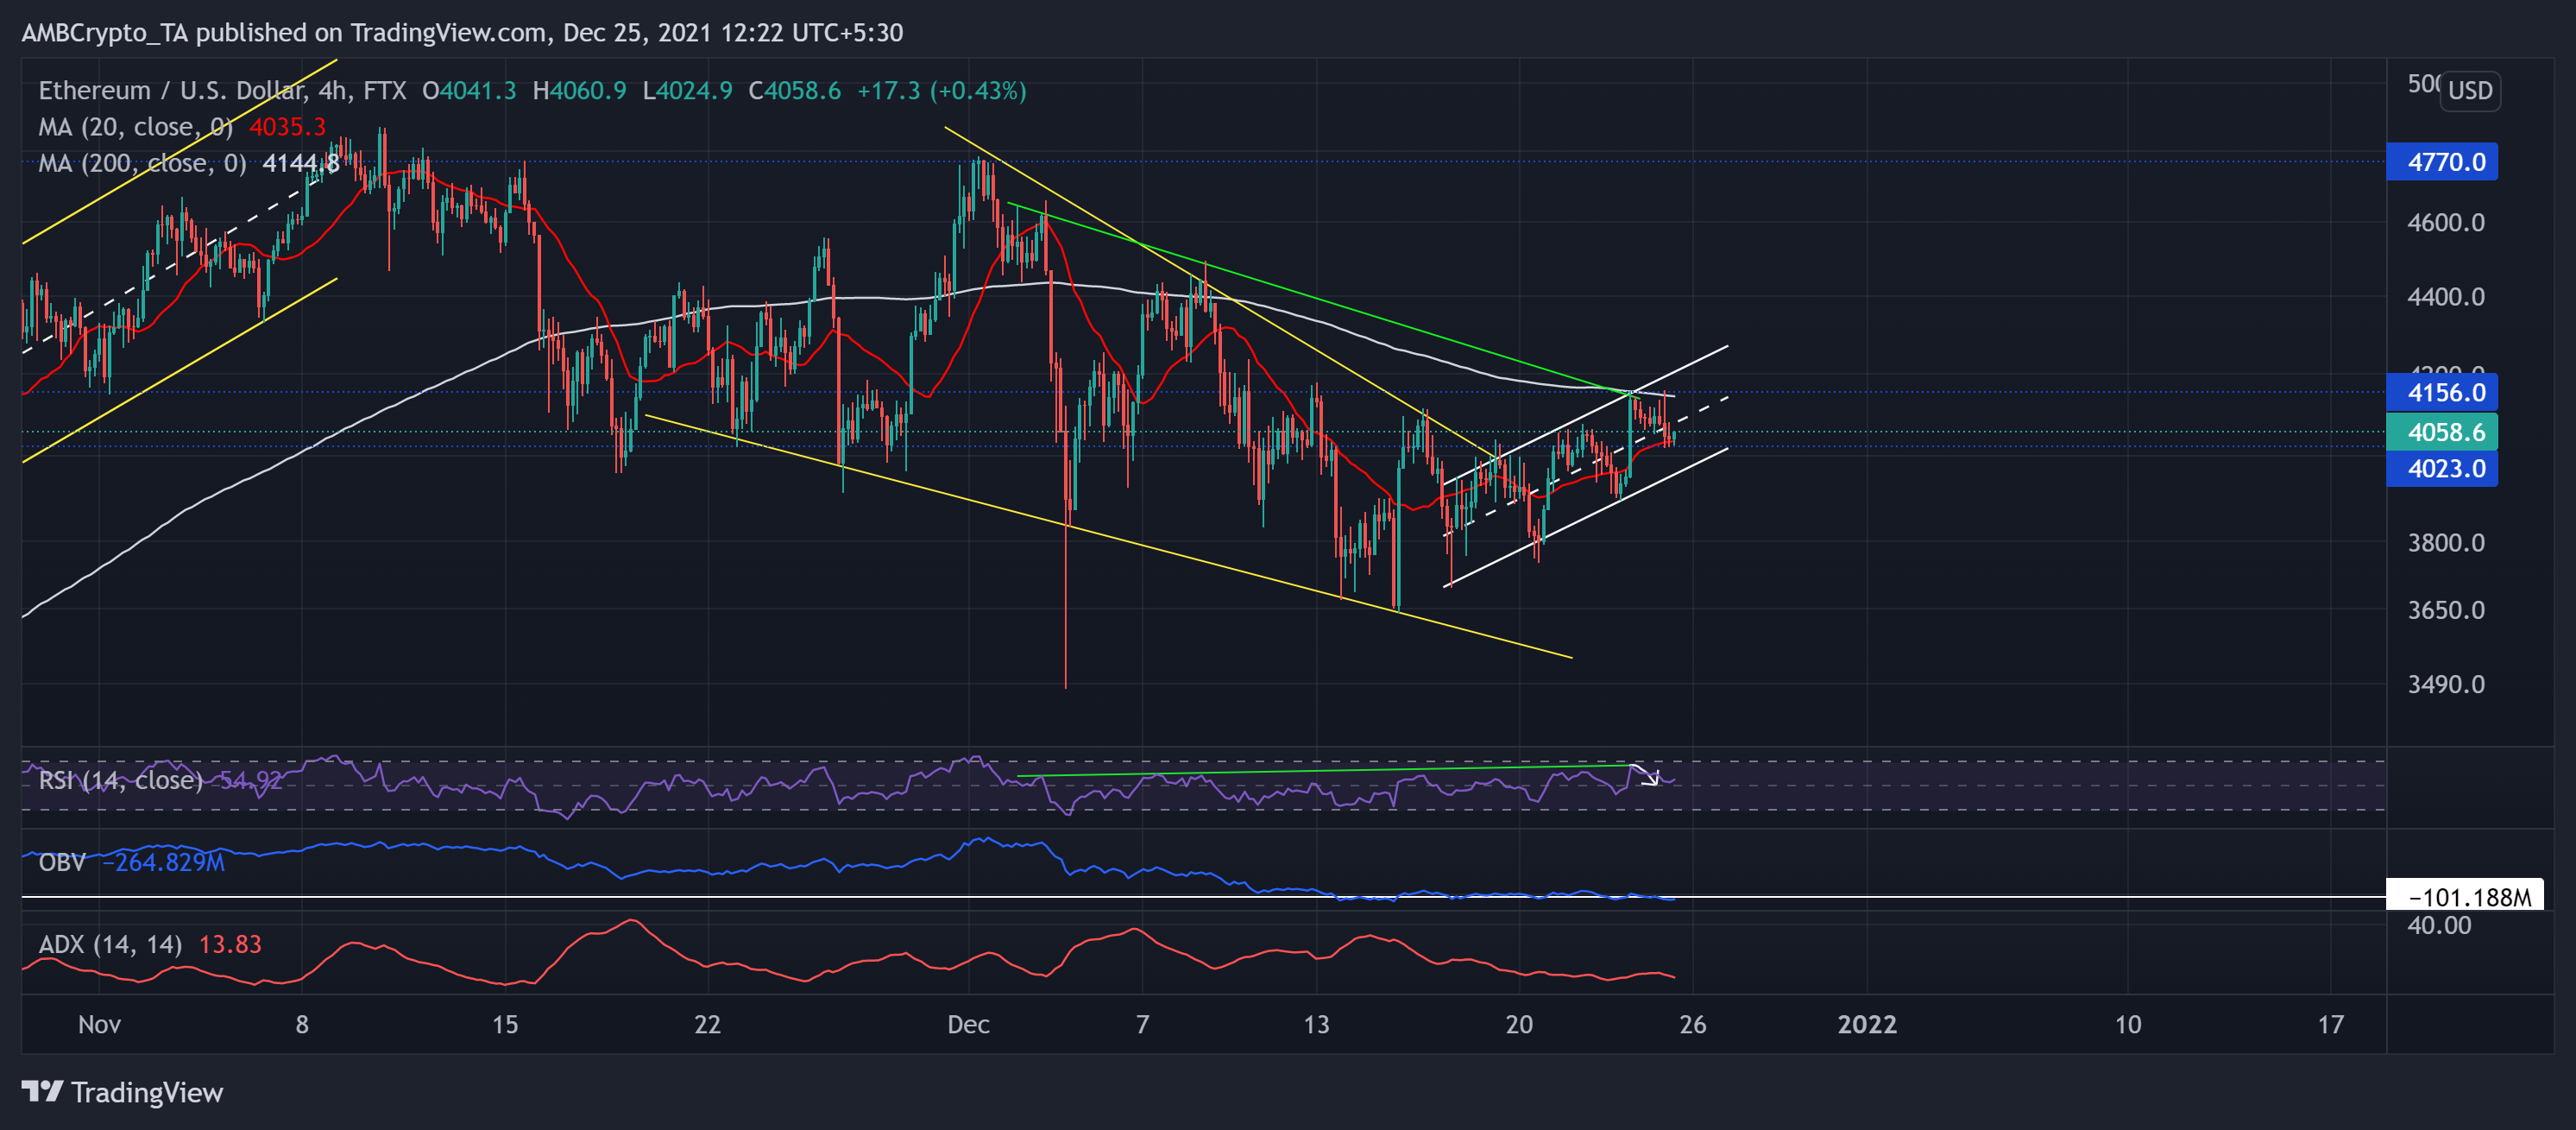
On its 4-hour chart, ETH saw a trend reversal over the past week as it broke out of the month-long falling wedge. Since 17 December, it oscillated in an up-channel after snapping off the $4000-mark. The bulls managed to sustain the price above this level after testing it a handful of times and persistently marking higher lows.
However, the rally halted at the $4,156-mark after a month-long bearish divergence (green). This level also coincided with the upper channel (white) and 200-SMA (grey). Now, the immediate testing support stood at the $4,000-level and the 20-SMA (red).
At press time, ETH traded at $4058.6. The RSI saw a pullout after poking its three-week high but swayed above the half-line. However, The OBV wavered around the same region since 13 December and visibly did not correspond with the uptrend. Also, the broader directional strength for ETH remained weak as per the ADX.
Solana (SOL)
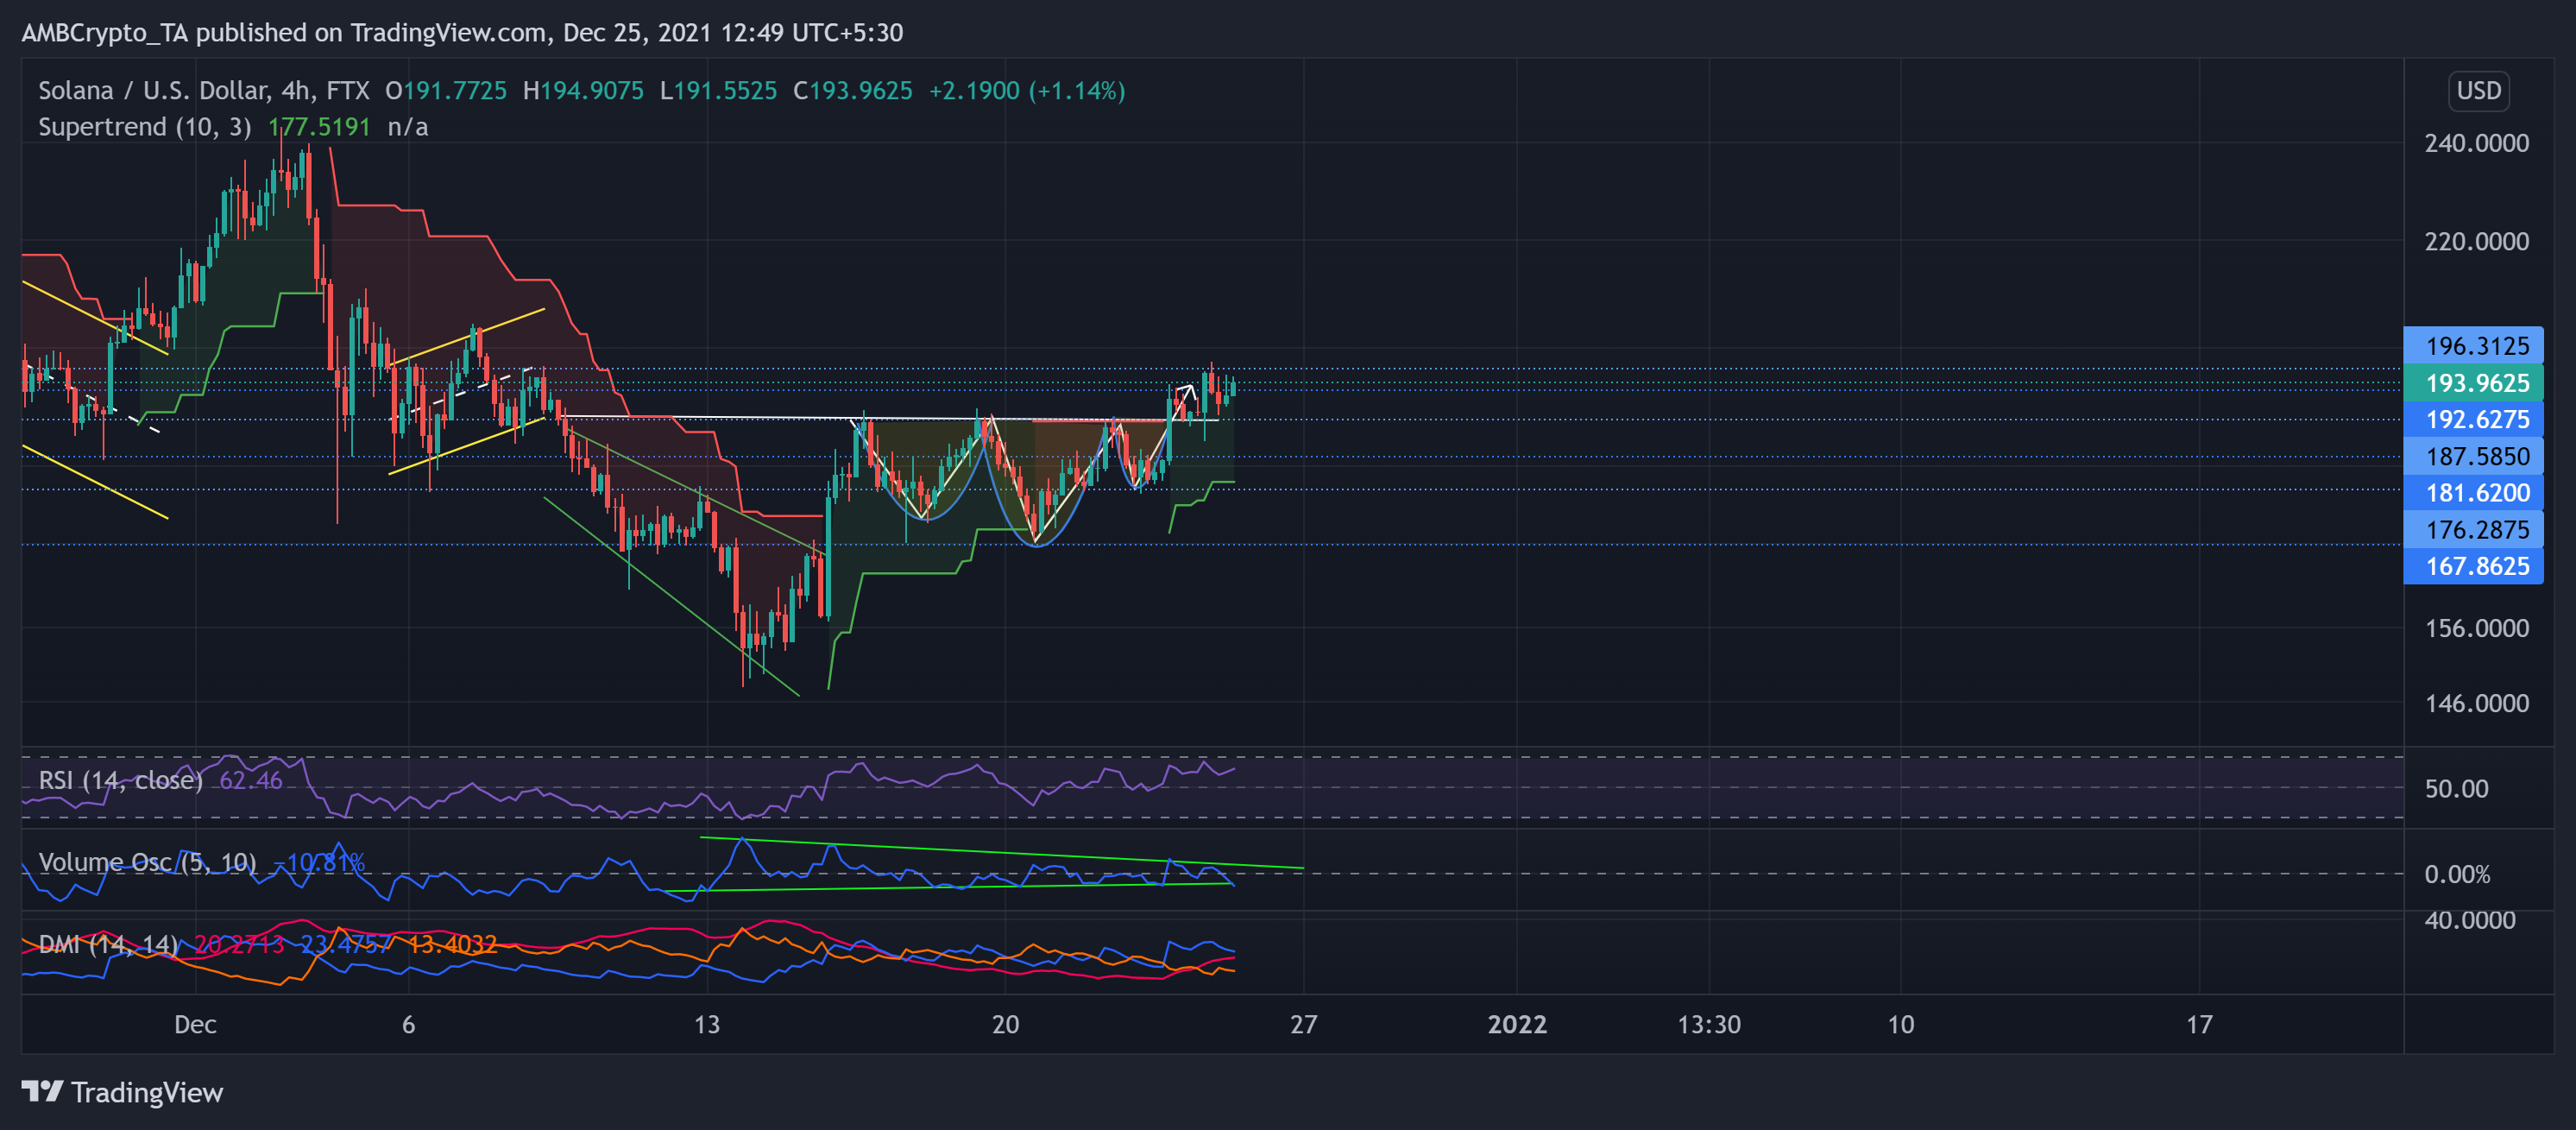
SOL saw a sharp rise after witnessing an inverse head and shoulder on its 4-hour chart. The alt saw an over 10% jump from the 23 December low as it breached the $192-mark. The bulls tested this level for the past three days while marking higher lows. Meanwhile, Supertrend flashed buy signals.
The ascent halted at the $196.3-level resistance, while the immediate testing support stood near the $192.6-mark.
At press time, SOL traded at $193.9625. The RSI was northbound after marking higher lows over the past four days. Further, DMI affirmed the previous readings, but the ADX displayed a weak directional trend. Besides, the Volume Oscillator has been marking lower highs since 13 December, indicating that the buyers have not yet assumed complete control.
Fantom (FTM)

FTM witnessed a solid reversal as the price action saw an over 66% (from 20 December low) gain in just the past four days. This rise snapped off the long-term trendline resistance (green).
The alt persistently slackened after striking its ATH on 28 October. The bulls, however, ensured the $1.25 support as it bounced back to cross the $1.9-mark.
At press time, the alt traded near its supply zone at $2.1281. The RSI was deep into the overbought region while a reversal threat exists in the near term. Additionally, the AO visibly depicted a one-sided bullish influence. However, the volume oscillator failed to mark higher lows, indicating a weak bullish move.


