Ethereum, Terra, Filecoin Price Analysis: 29 December

As the crypto fear and greed index saw a 14 point plunge in the last 24 hours, the fear sentiment surged. Thus, on account of a broader sell-off, Ether and Filecoin dropped below their 20-50-200 SMA.
The king altcoin lost the vital $4,000-mark while Terra lost the 23.6% Fibonacci support.
Ethereum (ETH)

Ethereum lost the crucial $4,000-mark again as bulls failed to flip the overall sentiment. After a month-long falling wedge (yellow), ETH upheld the 11-week support at $3,766-level as the price action broke out in an ascending channel (white).
While marking a 9.56% recovery phase, it found strong resistance at the 200-SMA (green) near the $4,150-mark. To top that up, a broader sell-off caused an up-channel breakdown as it retraced most of the above gain.
This fall pushed ETH below its 20-50-200 SMA and reaffirmed the ongoing downtrend. In terms of the strength of the trend, The OBV marked a corresponding downfall, confirming decreased buying pressure.
At press time, ETH traded at $3,806. The RSI saw a 30 point plunge over the past two days as it swayed in the oversold region. Also, the DMI preferred the sellers, but the ADX displayed a slightly weak directional trend for ETH.
Terra (LUNA)

LUNA saw a staggering 99.17% up-channel rally (from 14 December low) until it touched its ATH. After retesting the $100-mark four times, it poked its lifetime milestone.
Since then, the alt marked an over 16.9% fall as it lost the 23.6% Fibonacci support. The bears also flipped the 20-SMA (red) support to immediate resistance.
Now, the bears have tested the $84-level twice over the past day. Any further breakdowns would find testing support at the 38.2% Fibonacci level.
At press time, LUNA traded at $85.97. The RSI wavered around the 35-mark for the first time in 15 days and showed no revival signs at press time. Also, the OBV visibly affirmed the decreased buying power.
Filecoin (FIL)
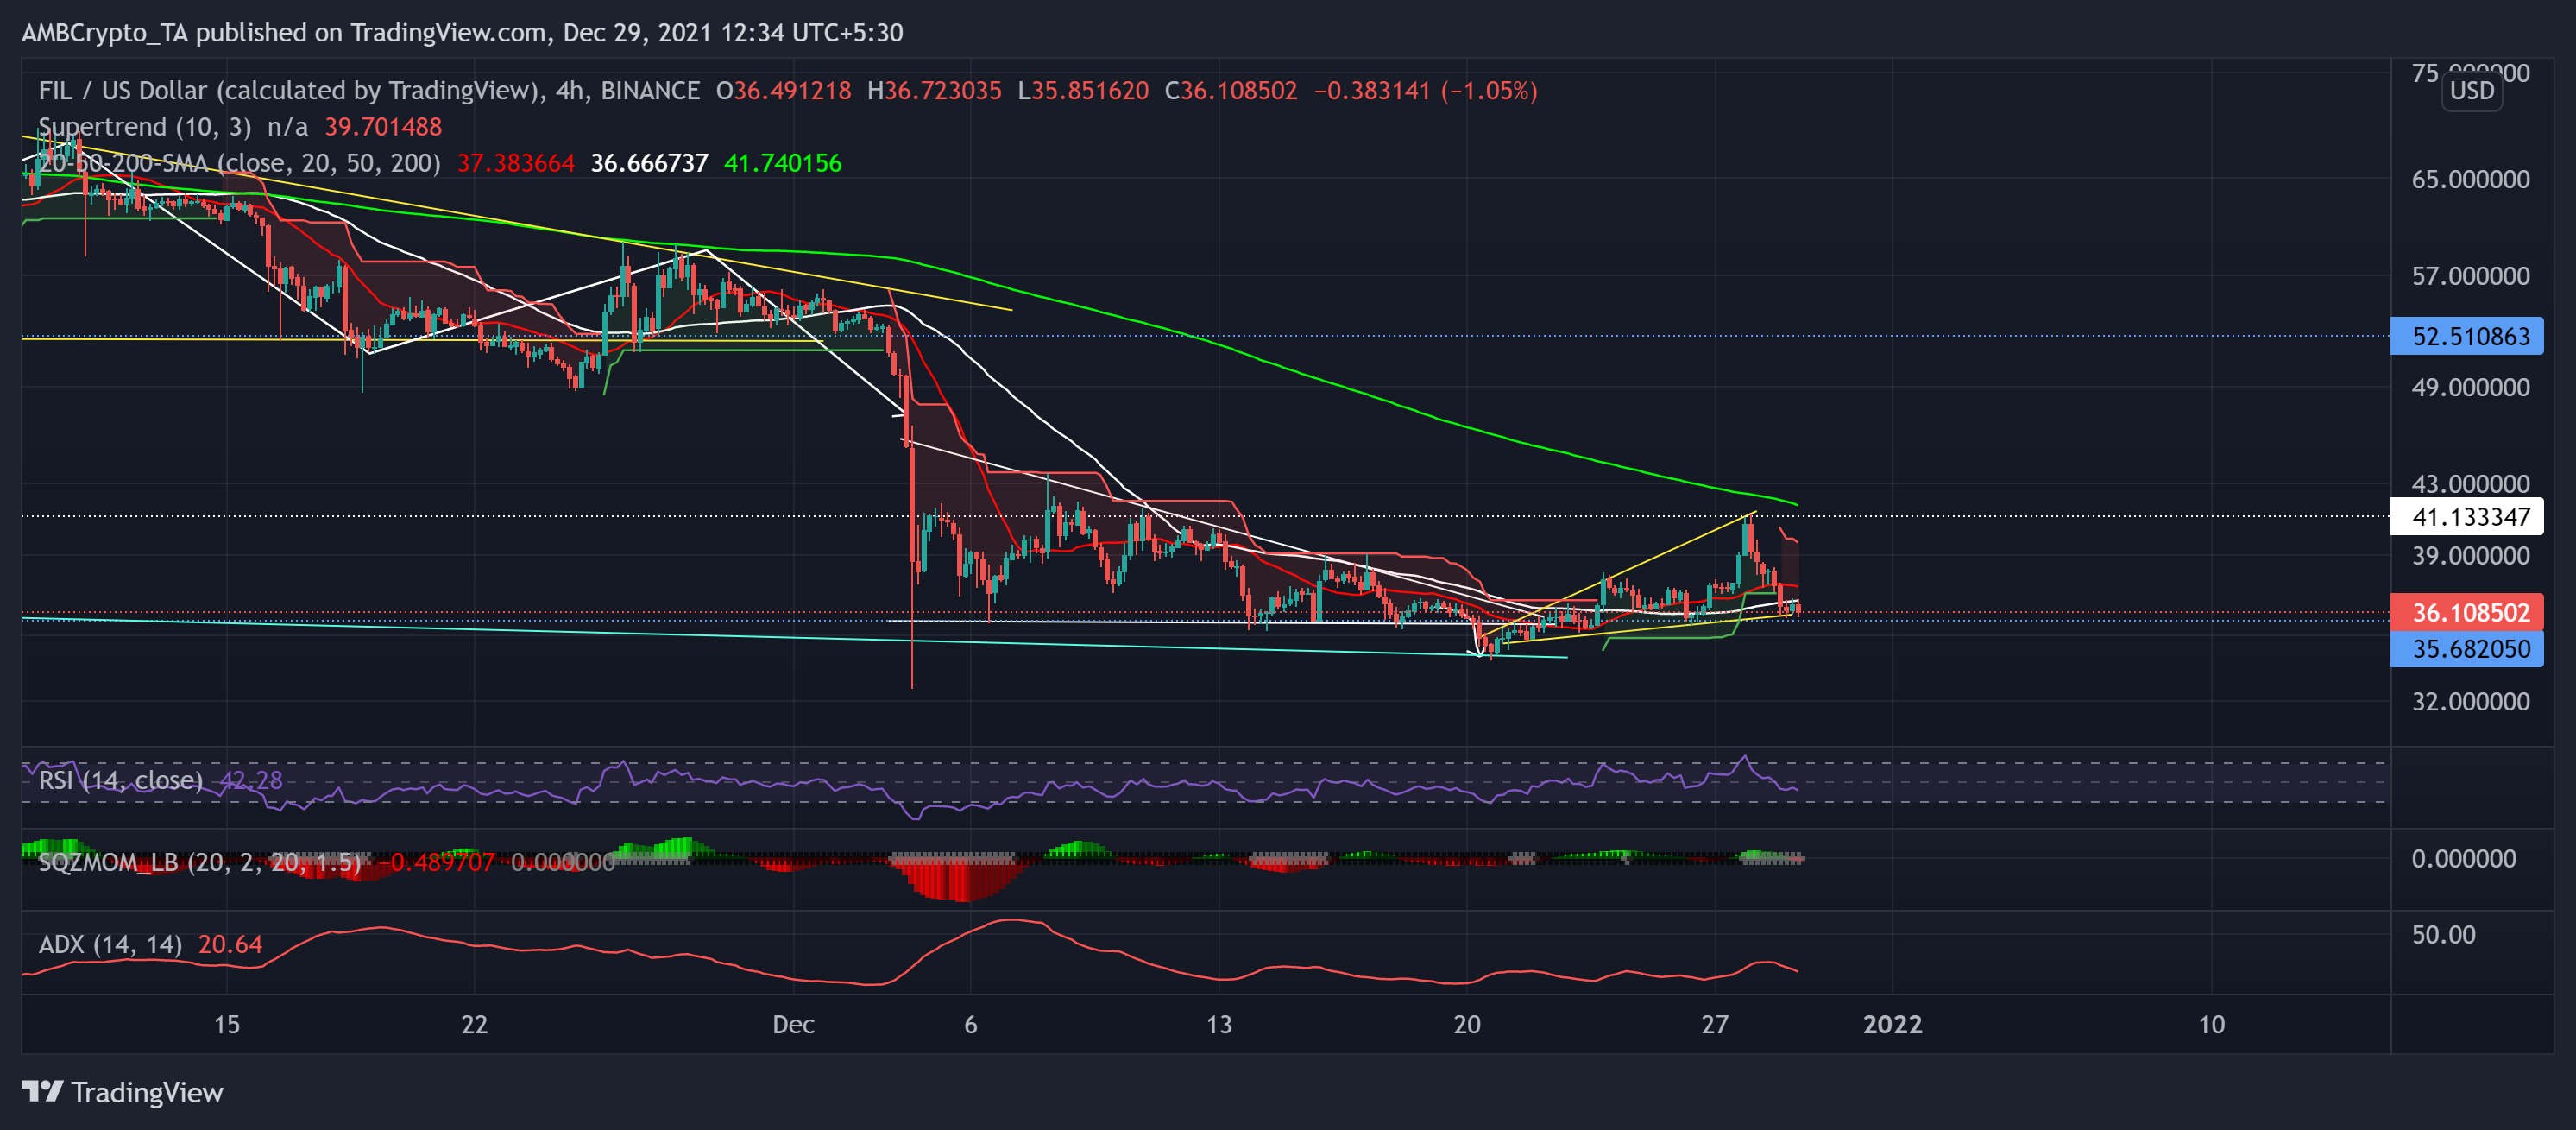
On its 4-hour chart, FIL saw an ascending broadening wedge (reversal pattern, yellow) over the past nine days. This pattern formed after the descending triangle breakdown found support at the long timeframe bearish trendline (cyan).
After poking its two-week high on 27 December, the alt saw a 12.93% decline over the past two days. Thus, the Supertrend visibly chose the long-term bearish tendencies and preferred the sellers.
At press time, the alt was trading below its 20-50-200 SMA at $36.1085. The RSI was in a sharp downtrend and showed no revival signs. Also, the Squeeze Momentum Indicator indicated a high volatility phase by flashing grey dots. Nevertheless, the ADX shared a weak directional trend for FIL.