Ethereum: These metrics can give aggressive traders some clarity

Ethereum [ETH] has witnessed quite a difficult journey in July. The alt’s price hit as low as $1,040 and then scorched up to $1,640 within a period of three weeks.
Such a price change of over 58% is a rare anomaly in major chains, such as Bitcoin [BTC] and Ethereum. But the latest ugly start to the week has raised a few eyebrows. And, you might ask- will Ethereum be a case of “buying the rumor, selling the news?”
Well, the Ethereum network is sending out mixed signs at the moment. This has made it difficult for traders to have certainty about ETH’s price movements.
Additionally, data from Santiment suggested that a “lot” of capitulation is happening. So where does Ethereum head from here? On-chain data can help us answer this question.
What does the data say?
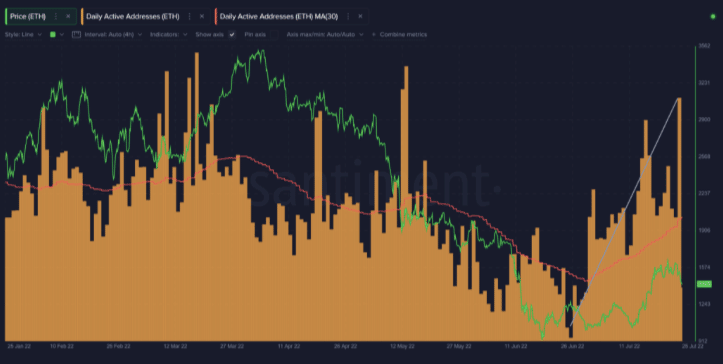
A positive spark on Ethereum is the growing number of daily active addresses on the network. Ethereum just crossed over 600k active addresses again for the first time since 13 May. This takes us back to when Ethereum was on the cusp of a fallout from the Luna explosion.
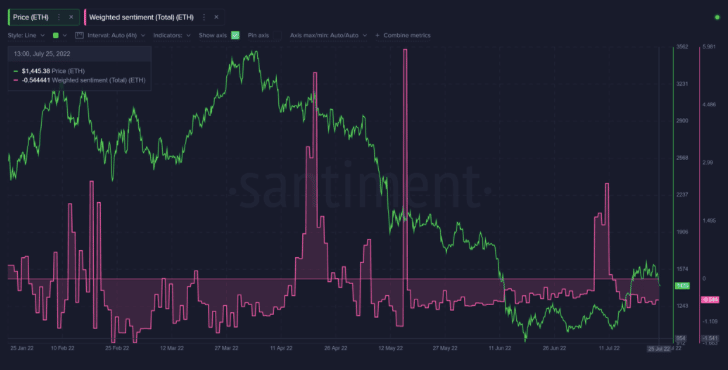
The weighted sentiment metric suggested that not many people are talking about Ethereum right now. The Merge news did ignite interest which hasn’t been able to sustain itself.
Even so, there is a negative bias towards Ethereum right now on social media. This is further reflected in the trader sentiment activity which is evident in ETH’s latest downfall to the $1,300 mark.
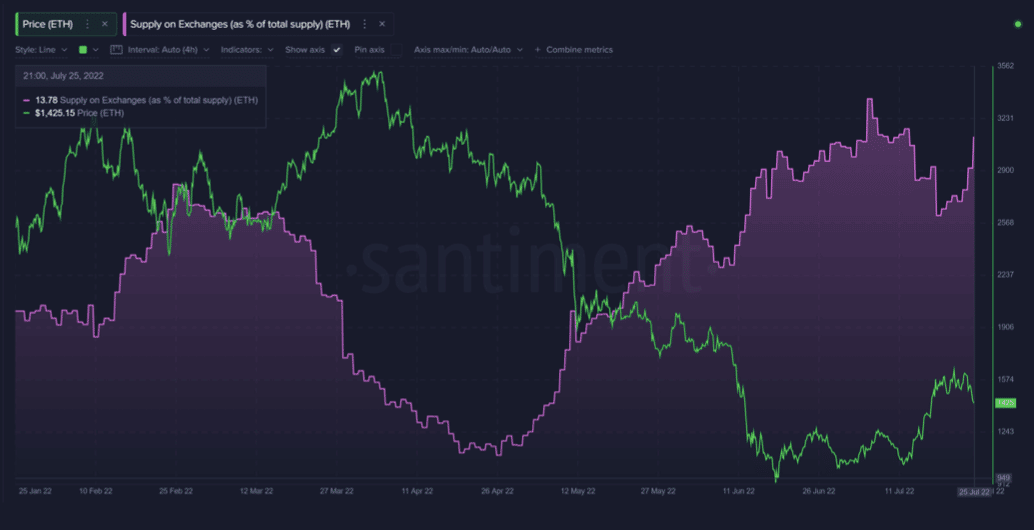
Even before the dawn of the crypto winter, Ethereum saw the beginning of a potentially worrying trend. The network’s coins sitting on exchanges had started to witness a steady rise after big retracements in 2022.
However, the trend is yet to scale any trend reversal despite the July relief run.
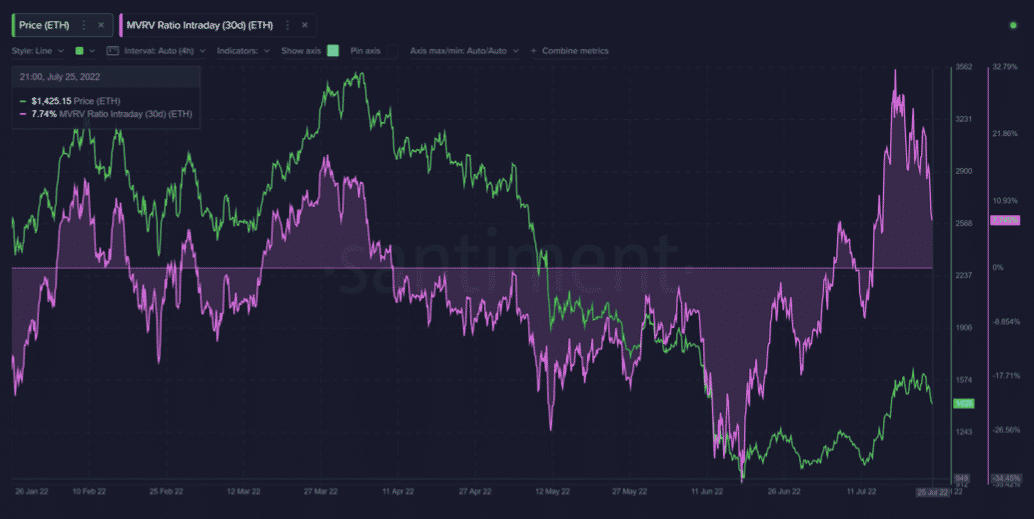
Furthermore, the Market Value to Realized Value (MVRV) ratio is another indicator of falling trader sentiment.
The average returns for traders in the past 30 days got over-inflated. In a metric where anything over 15% is a signal that a network’s profits are beginning to get overheated, ETH’s 30-day MVRV got up to a massive 33%. So until this ratio falls back to 0%, ETH trading remains a risky operation.
On the whole, Ethereum traders have been thrown into the question after the flagship coin lost the $1,620 level.
After a poor start to the week, ETH has fallen into negative territory again. This further throws light on the “severe” negative trader sentiment around Ethereum. It also means that traders are still pessimistic about Ethereum sustaining a price rise.
At press time, ETH was trading at $1,381 after declining by 8.62$ over the last day.


