Ethereum traders must look out for this throwback spurring a hike

Disclaimer: The findings of the following analysis are the sole opinions of the writer and should not be taken as investment advice
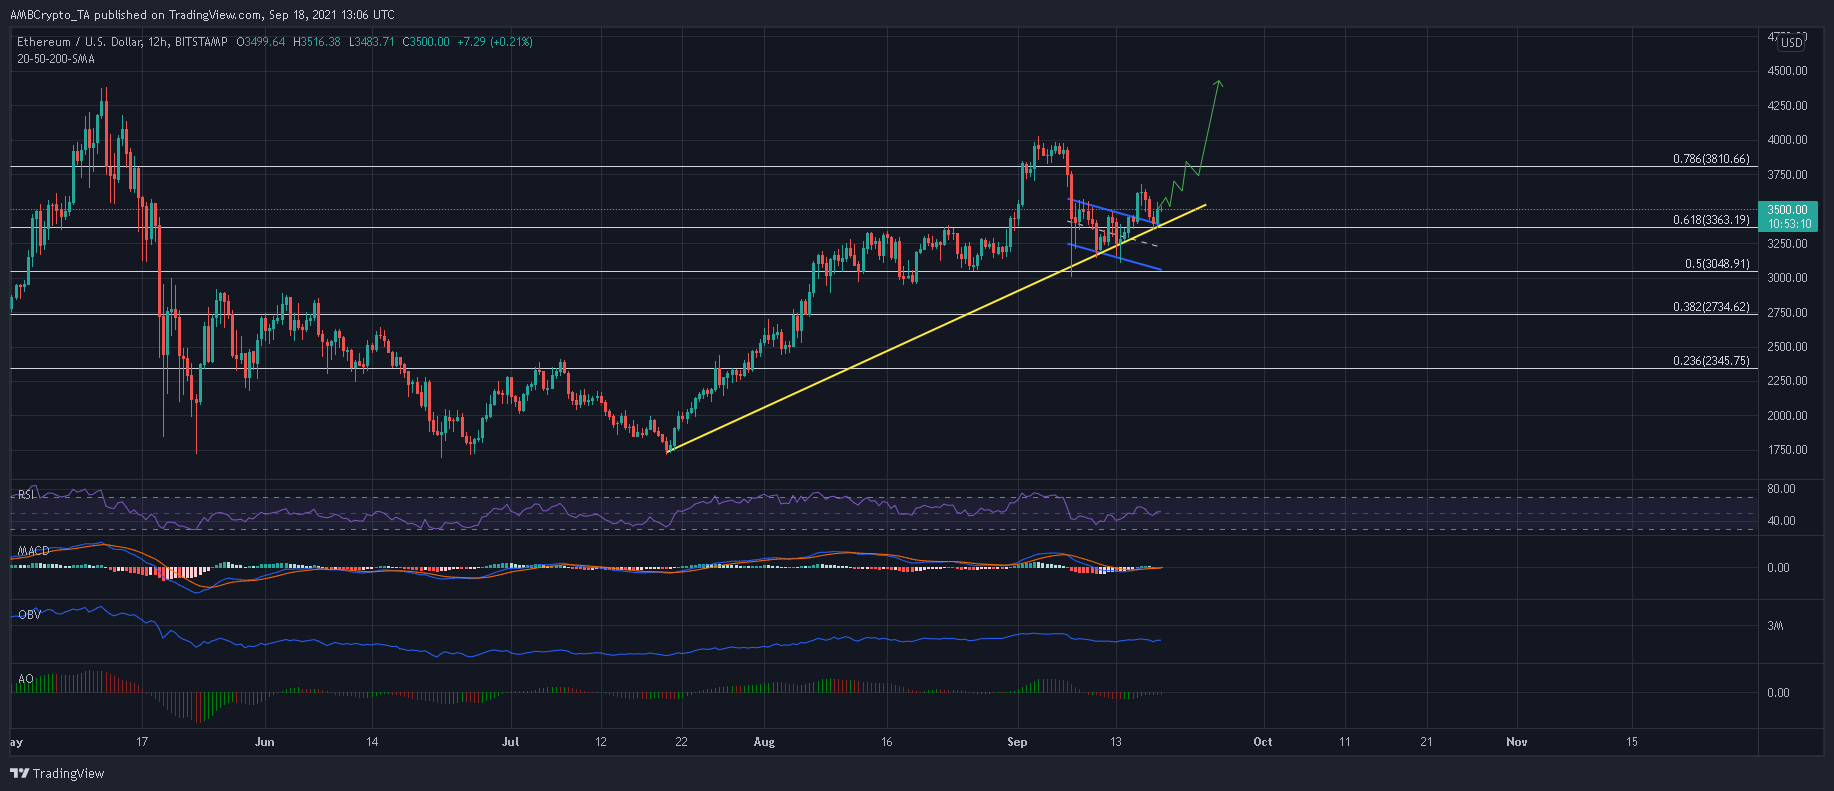
Ethereum has not disappointed since picking up from its late-July lows. While ETH was fairly quiet in August, volatility has picked up since the beginning of September and key price swings were observed. Recently, a throwback following a parallel channel breakout instilled hopes of another price surge up ahead.
At the time of writing, ETH was trading at $3,500, up by 2.16% over the last 24 hours.
Ethereum Daily Chart
Since dropping to a low of $1,720 in late July, ETH has been on a strong uptrend. After some stabilization in August, ETH resumed its upwards trajectory and formed a fresh peak above the 78.6% Fibonacci level. Although 7 September’s sell-off did threaten to overturn this cycle, buyers held a clear advantage which was outlined by a rising lower trendline.
Digging a little deeper into ETH’s movement over the past week revealed the formation of a down-channel. At the time of writing, a throwback was in effect after ETH broke north from this pattern on 15 September.
Now, throwbacks are quite important to understand the nature of a breakout. Usually, a throwback to a particular resistance, the 78.6% Fibonacci level, in this case, helps fuel another price surge going forward. If this scenario plays out as expected, ETH can be expected to scale above $3,800 and 3 September’s swing high of $4,030.
From there, ETH’s next destination would be above its previous ATH of $4,380.
However, a throwback does not necessarily trigger another rally. If the support levels succumb to selling pressure, another drawdown is usually seen. In such an outcome, ETH would retest its 50% Fibonacci level at $3,048.
Reasoning
While ETH has remained gridlocked between two possible outcomes, the indicators failed to identify a clear winner. The MACD and Awesome Oscillator treaded along their mid-lines due to weak momentum on either side. Some optimism came from via the RSI which formed higher lows. However, the same was yet to rise above 60 to assert a more bullish scenario.
Conclusion
Based on the nature of ETH’s throwback, there were chances of another price surge in the coming days. Levels such as $3,800 and $4,030 would lie in wait if a favorable outcome is observed.
Meanwhile, traders must keep a close eye on the aforementioned indicators. Further progress in the bullish territory would heighten the chances of a price hike.


