Ethereum, VeChain, Ethereum Classic Price Analysis: 27 June

The global crypto market witnessed a 2.22% increase in its total capitalization over the last day. Bitcoin too noted a 2.5% price surge during the same time, crossing over the $33,000-mark in a southbound movement. Ether, VET, and ETC’s positive price movements over the past two days were also noticeable, even if slightly negligible in the case of VeChain. Market volatility had stabilized, and the coins were expected to have a range-bound movement going forward, as they strive to consolidate their prices.
Ethereum [ETH] –
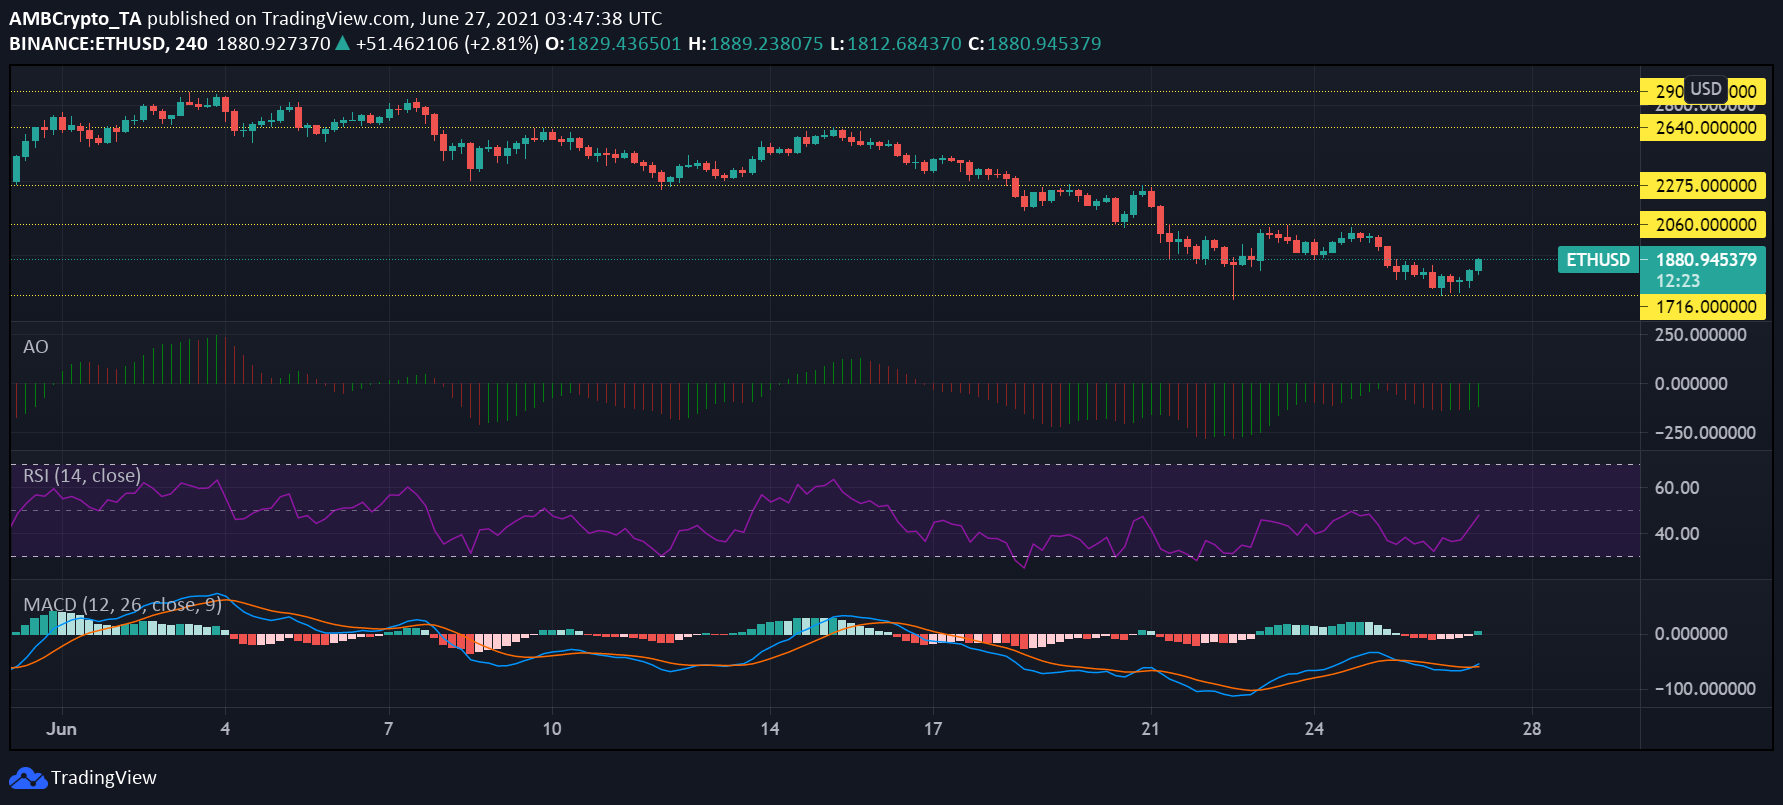
After a 10% price fall since 24 June, the second-highest ranked coin Ether started to follow an upward movement yesterday. Bullish momentum could be pictured creeping in on the coin’s price chart, as green lines began to appear under Awesome Oscillator’s histogram. MACD indicator registered a bullish crossover last night, as the indicator line (blue) moved over the signal line (red). The divergence of the two lines indicated that the upside momentum was increasing.
Moreover, Relative Strength Index (RSI) saw a reversal from its downward movement on 26 June. Buying pressure for the coin could be seen mounting, as the indicator had risen to equilibrium over the past day before plateauing.
While a bullish sentiment could be seen surfacing on the asset’s market, it was unlikely for the digital asset to break out of its price range of $2,060 and $1,716 in the near future.
VeChain [VET] –
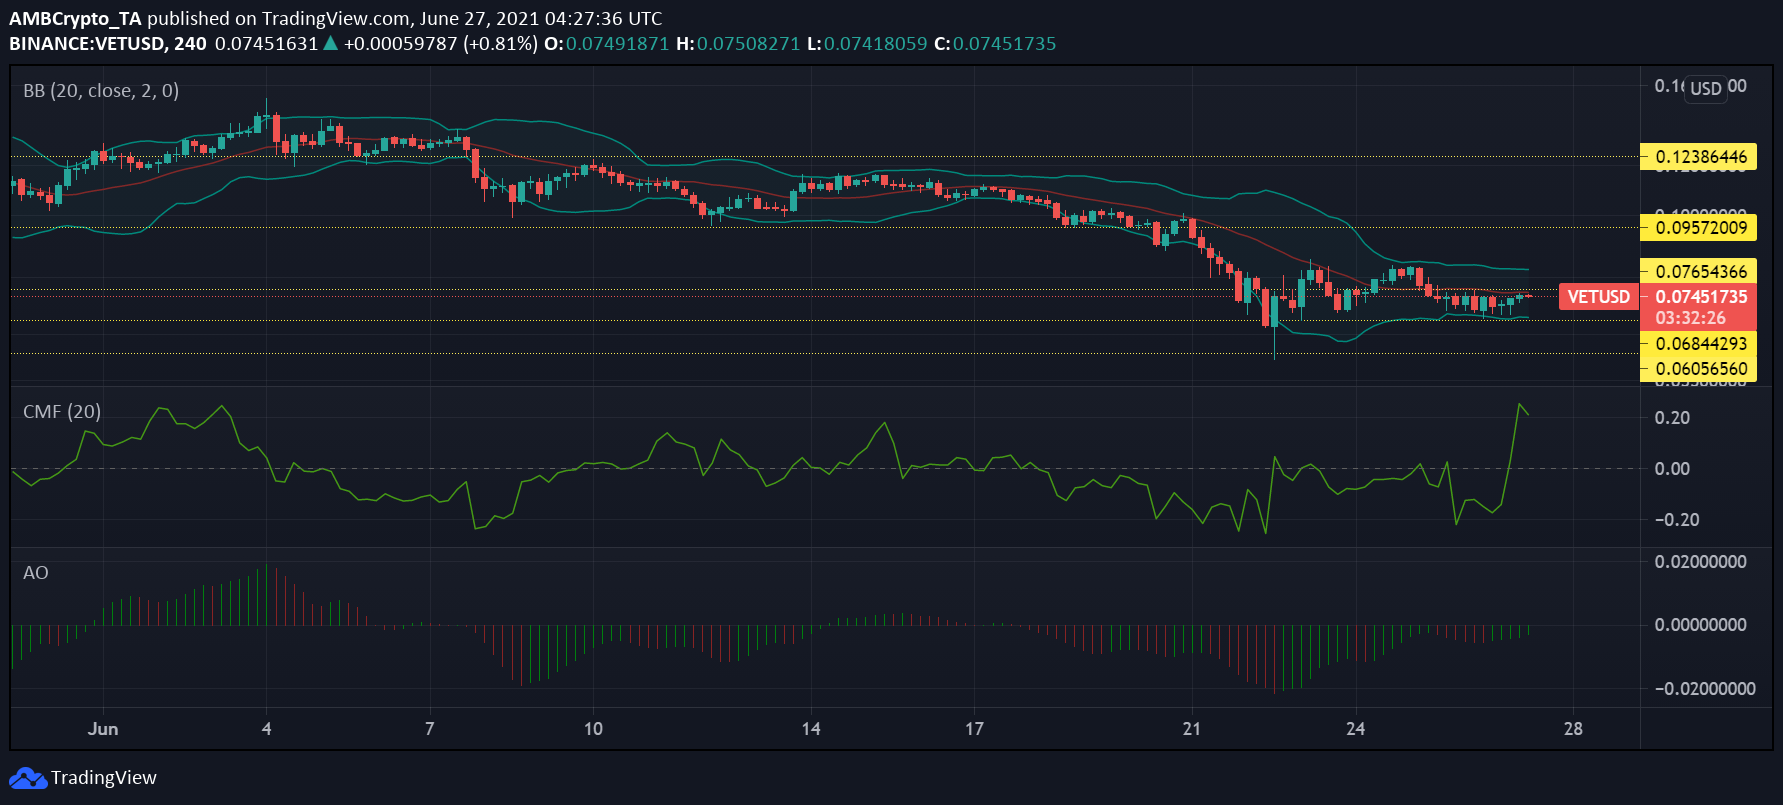
VET witnessed only a slight 0.3% positive price change over the past day, even as its 7-day price fall was 23.1%. After remaining in the negative zone for over 10 days, Chaikin Money Flow suddenly pictured a very steep rise in capital inflows. Even as outflows continued to remain comparatively low, the indicator did note a downtick early morning today.
The appearance of small green lines below Awesome Oscillator’s histogram suggested that bullish momentum had started to surface since yesterday. Market movement and volatility were stable, noted through the parallel movement of the Bollinger Bands. Steep price action could not be expected going forward.
The relatively stable market and the coin’s horizontal movement over the past day suggested that its price action could remain constricted between the $0.076 resistance and $0.068 support levels going forward.
Ethereum Classic [ETC] –
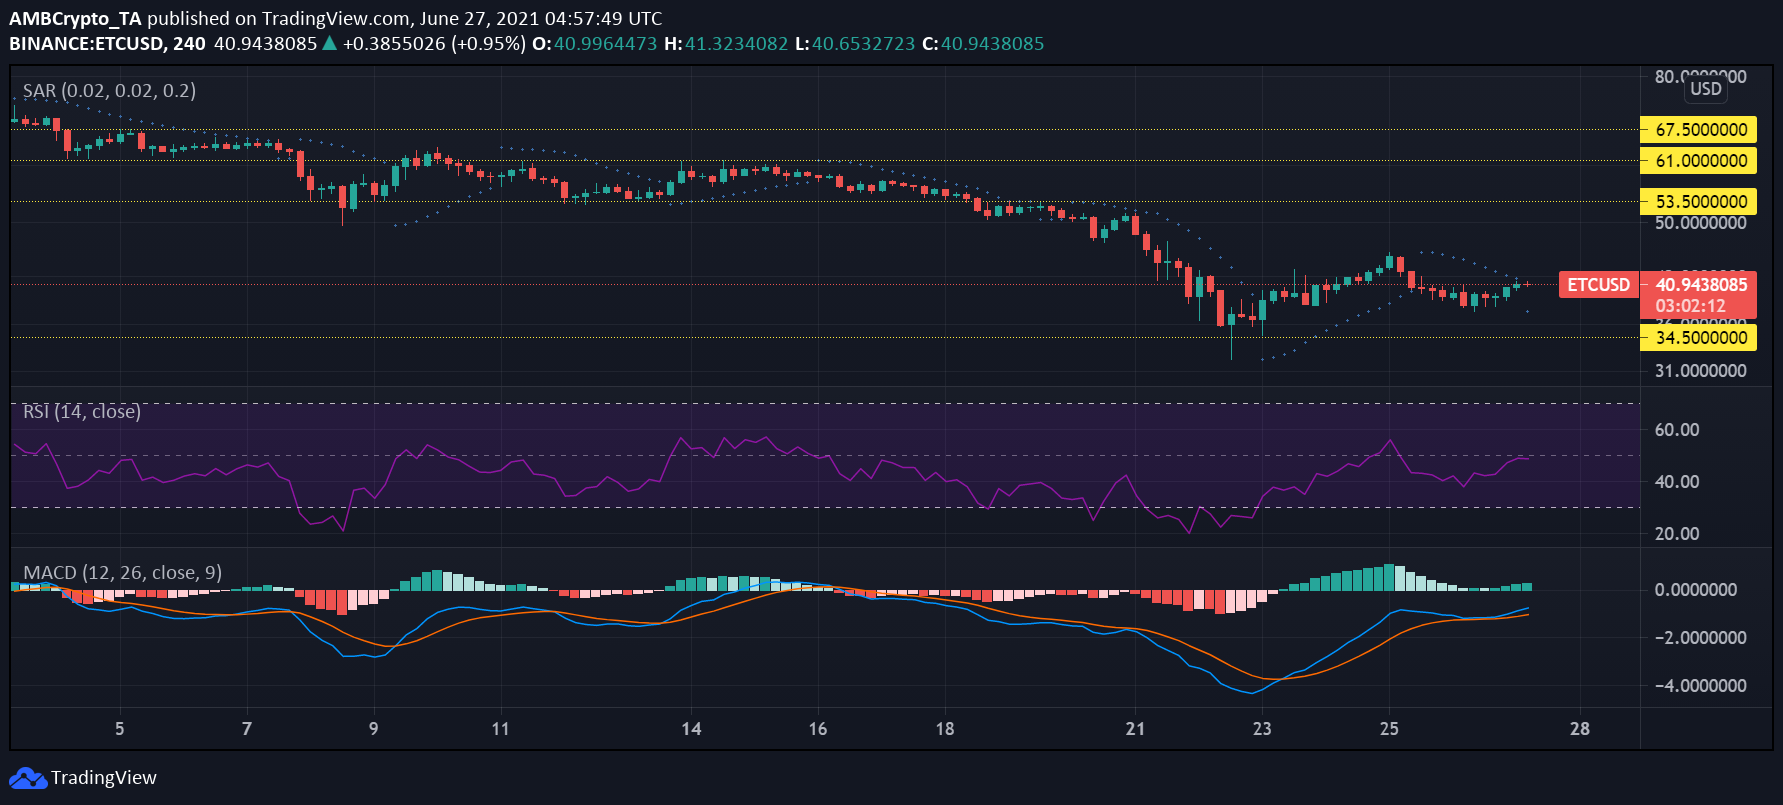
June has been an unfavorable month for ETC, as its valuation fell by 44.9% in the past month. The coin was trading in the red at press time, priced at $41.05. It did note a 0.9% 24 hour-gain, while its weekly ROI was down by 24.45%.
Parabolic SAR’s dotted line had hovered above the candlesticks since 25 June, as the asset’s price movement had been following a bearish trend. However, appearance of dots below the south-bound green candlesticks today indicated that trend reversal was underway.
MACD indicator lines diverged below the baseline, remaining in a bullish crossover. Relative Strength Index (RSI) had pictured an upward movement yesterday, as buy-outs started taking place. However, the indicator started to plateau just below the median line, as it remained in neutral bearish territory.
Based on the indicators, the coin was at the doors of the bullish realm at the time of writing. Sharp price movement from the coin remains unlikely, as it too moved in a sideways manner.