Ethereum: Why this move may not be the right call for traders!

Ethereum breaches $2300; so is it time to fill your bags? Exit the market or continue Hodling – these were the two main questions on Ethereum traders’ minds.
The first significant recovery in weeks was observed for Ethereum as the largest altcoin breached above the $2300 valuation. ETH recorded a value above $2300 for the first time since June 18th. The $2300 has also served as a historical resistance so there are a few indications that a substantial bullish momentum might unfold, taking the price higher in the charts.
Ethereum Put/Call Ratios consistently down
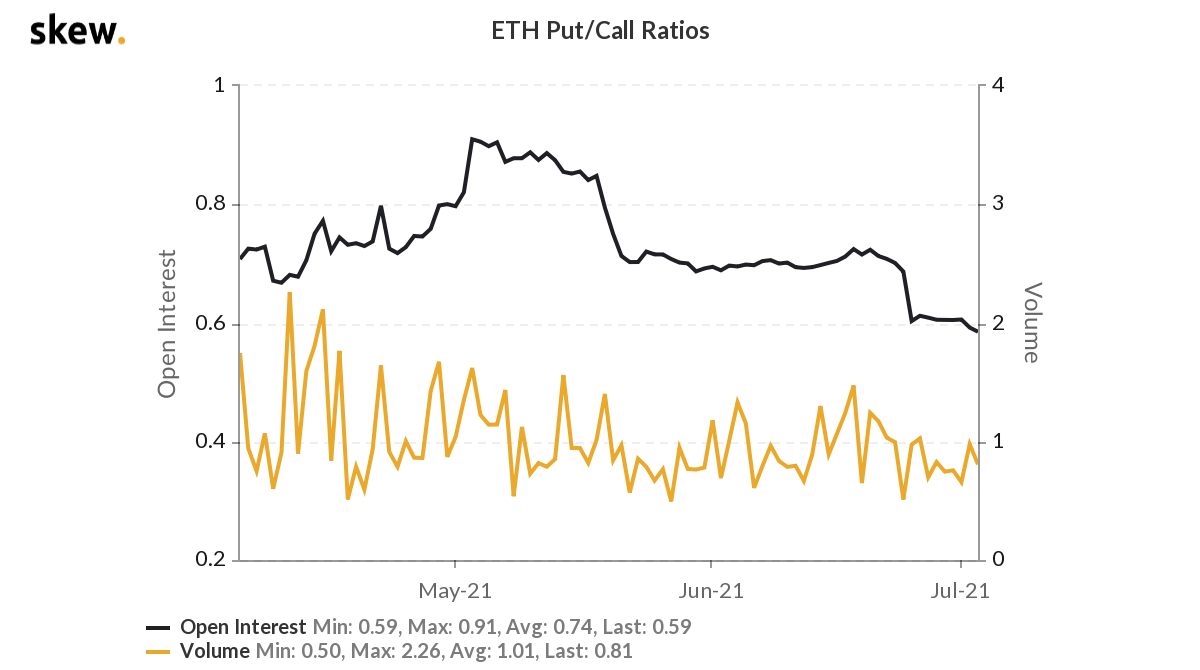
At the beginning of May 2021, Open-Interest for ETH Put/Call Ratio was at 0.91 but over the past few weeks, the ratio has dropped down to 0.59. It indicated that during the bearish period, selling contracts have undergone expiry or hit their exit points, with rising call orders. So traders are currently expecting prices to recover as the selling pressure reduces in the charts.

Additionally, the change in sentiment can also be identified by the fact that 27% of the Options Traders expect Ethereum to close above $2600 by the end of July, which comfortably sets it to re-test critical resistance at $3000 during the period. While these actions do indicate a reversal in the bearish trend, few factors weren’t exactly all green.
Importance of Implied Volatility?
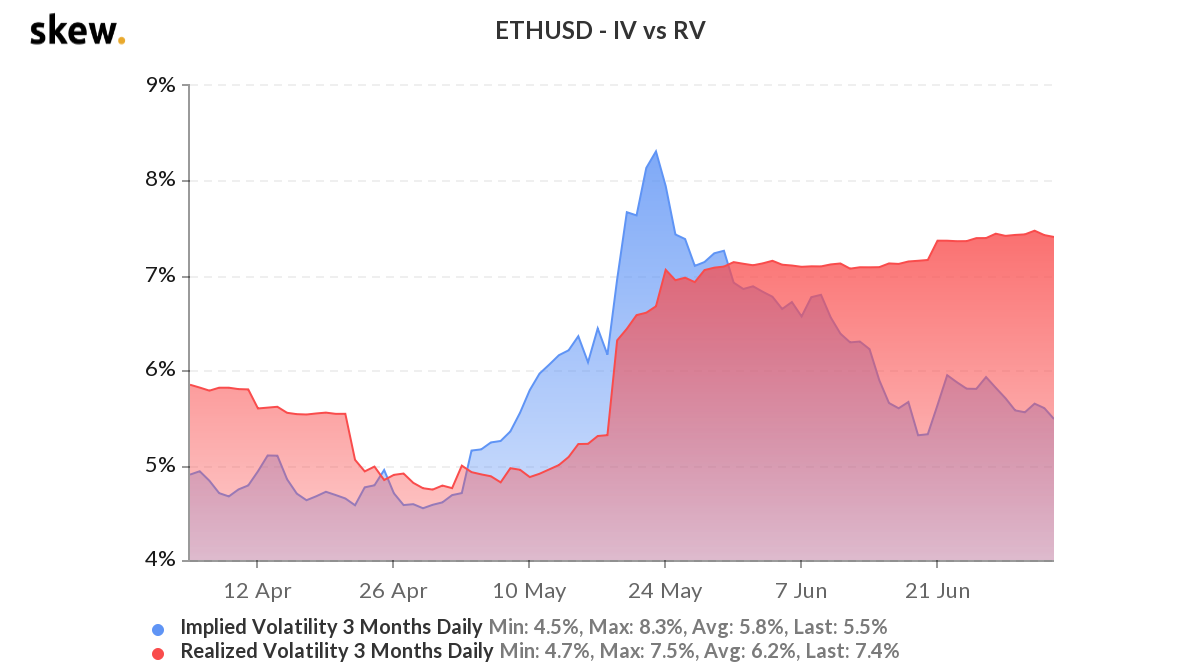
Now, the role of implied volatility has been identified pretty well during a bullish recovery, which raises the concern that at press time, it had continued to taper off to a lower range. Realized Volatility stagnated but the reducing implied volatility suggested that prices are still under a cautious bracket, where it isn’t expected to breach strong resistance levels.
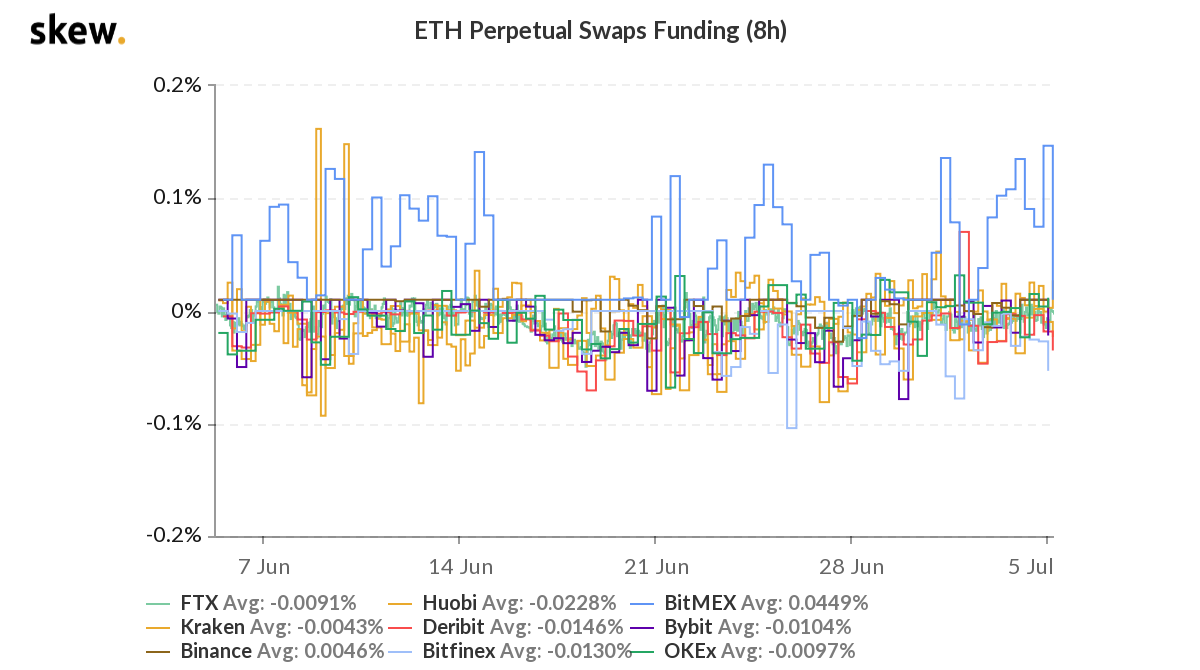
Ethereum futures perpetual funding across various exchanges were also a mixed bag of results. Whenever the overall funding rate is positive, it is a healthy bullish sign since long orders are paying a dividend to the short orders but a variable rate across different platforms suggested uncertainty.
So what does the current price structure suggest?

Keeping the past week in context, it is a positive turnaround that Ethereum recovered over 17%, eventually closing above the $2300 mark. Yet, if the current daily chart is observed, it is presently facing some bearish pressure, which has immediately taken the asset below the $2300. It is important to understand that this could be a reactionary correction and the target remains $2650 if stronger confirmations are needed for a bullish lockout.
Until then, it is still early to call whether Ethereum has broken off bearish shackles or not.


