Exploring the long-term bullish and bearish cases for Axie Infinity

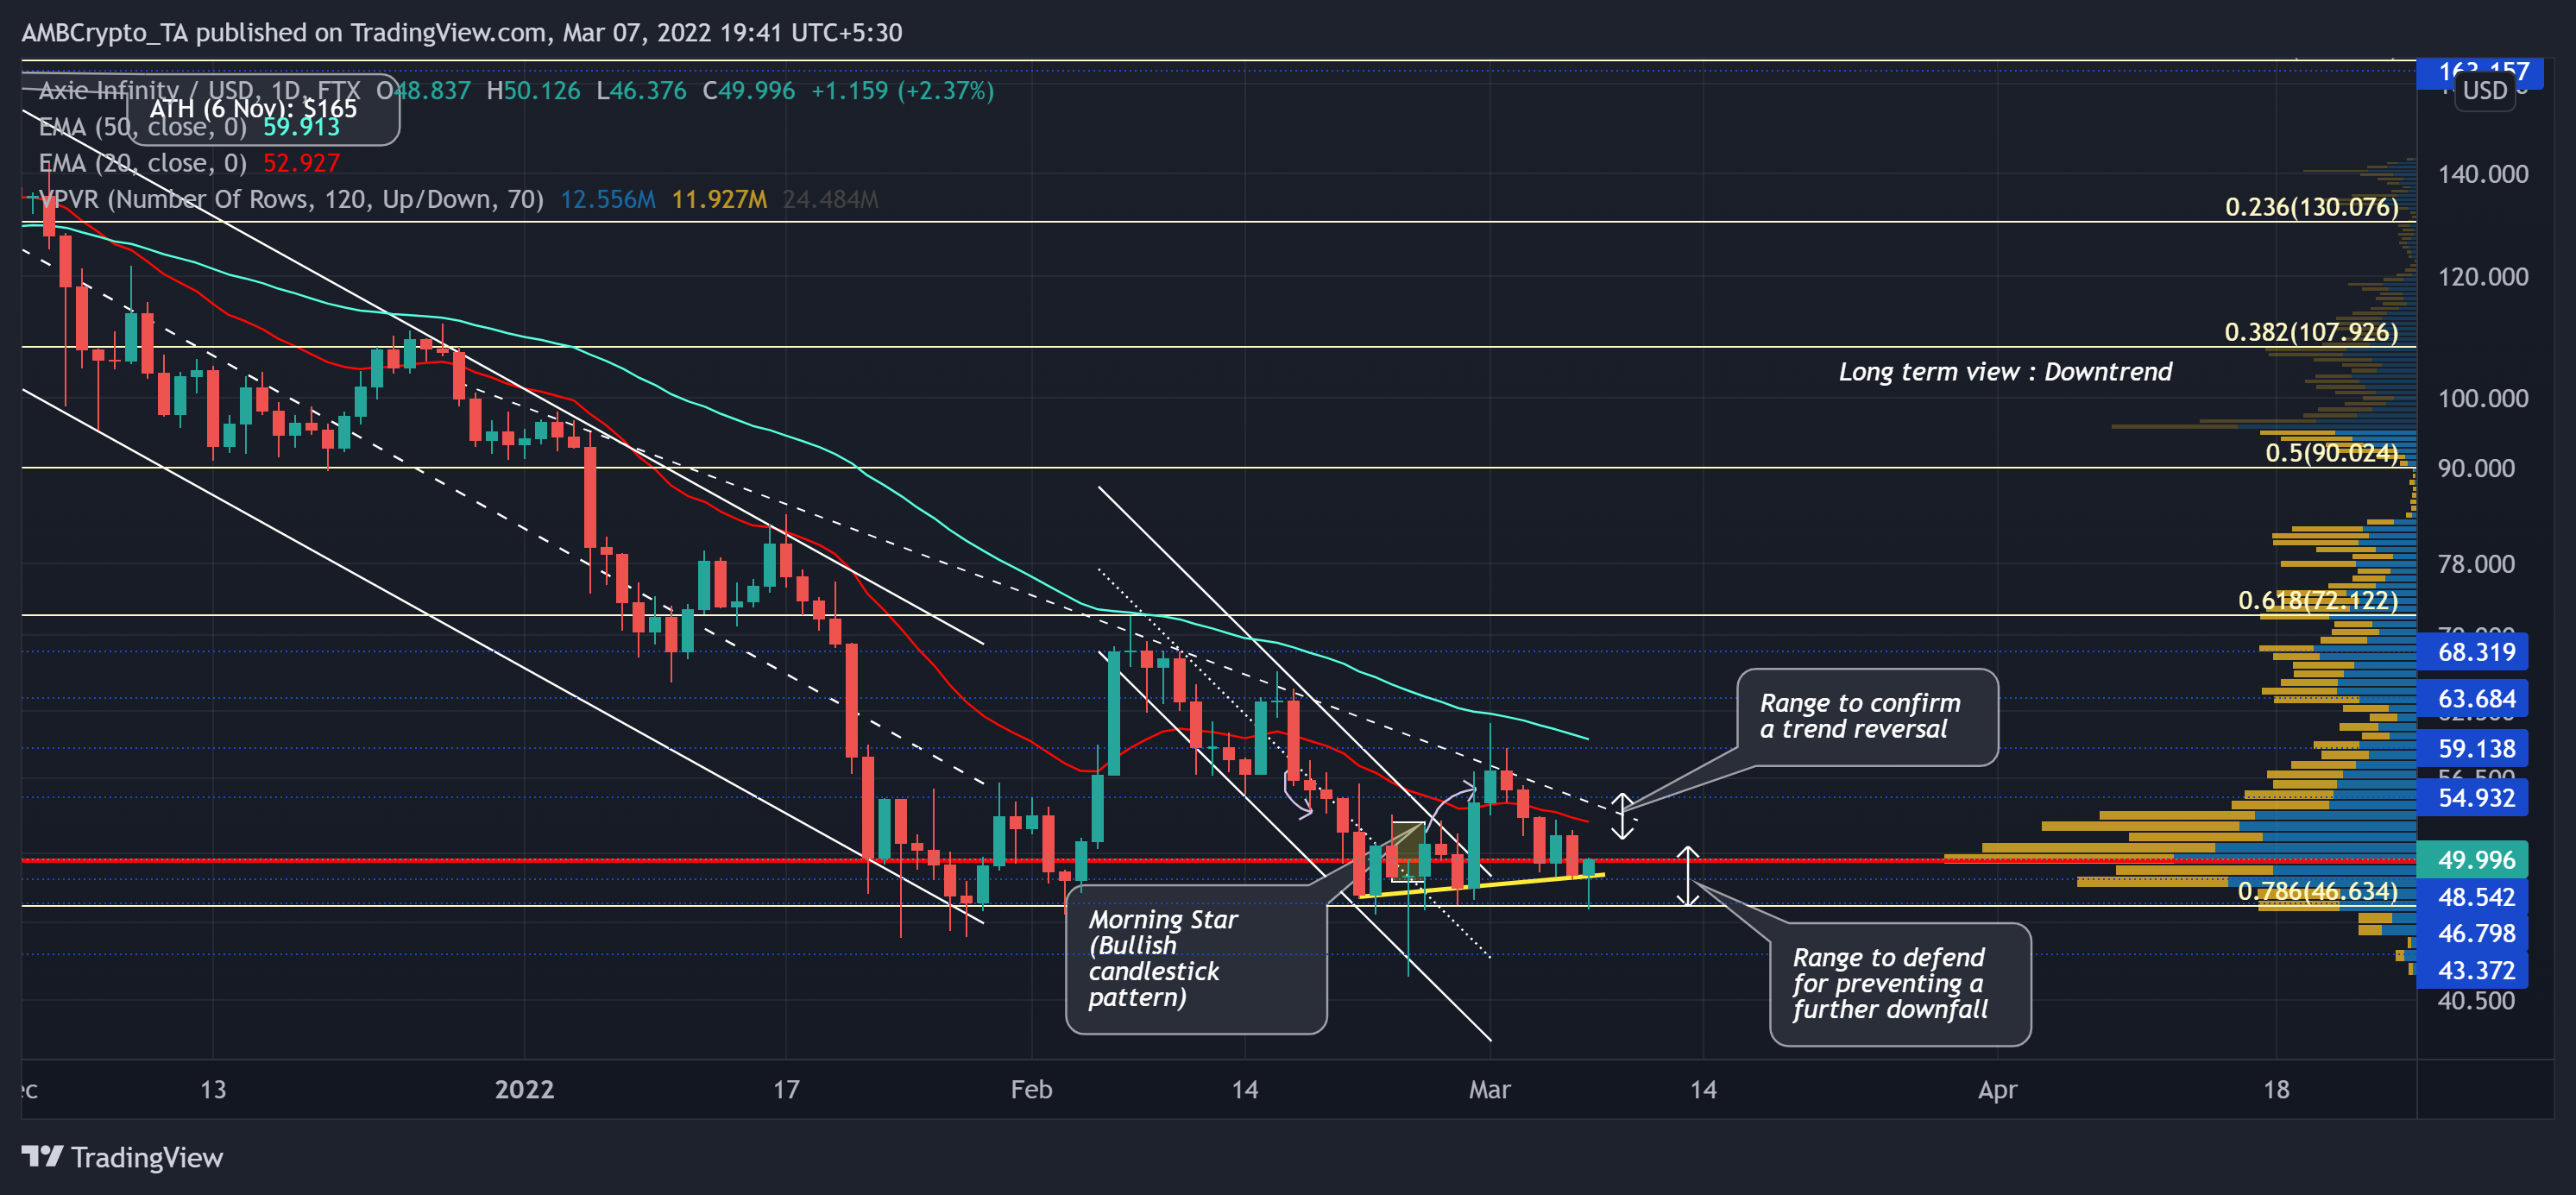
As anticipated in the previous article, Axie Infinity (AXS) saw a patterned breakout towards the $54-mark. Now, it entered into a tight phase while forming strong trendline support (yellow) on its daily chart.
Assuming bulls can uphold this trendline support, as they have for over two weeks, AXS would aim to challenge its Point of Control (POC, red) and continue its squeeze phase between the $50-$53 range. Following this, the buyers would try to build up thrust to overturn the $54-resistance. At press time, AXS was trading at $49.996.
AXS Daily Chart
The retracement phase marked two down channels (white) on its daily chart as the alt lost nearly 74.4% of its value (Since its ATH) and touched its six-month low on 24 February. As a result, AXS struggled to sway above its 20/50 EMA.
After losing the golden Fibonacci support, AXS has been trying to keep up with the selling pressure and maintaining the 78.6% support. The $46-$50 range is extremely vital to prevent a further downfall.
After witnessing a morning star bullish candlestick pattern, AXS was able to break out of the latest down-channel while forming trendline support (yellow).
A compelling close above the POC would likely cause the alt to traverse in a tight phase between its 20 EMA (red) and POC. If the bulls find a close above the $51-$54 range, a near-term trend reversal might be lurking around the corner.
Rationale
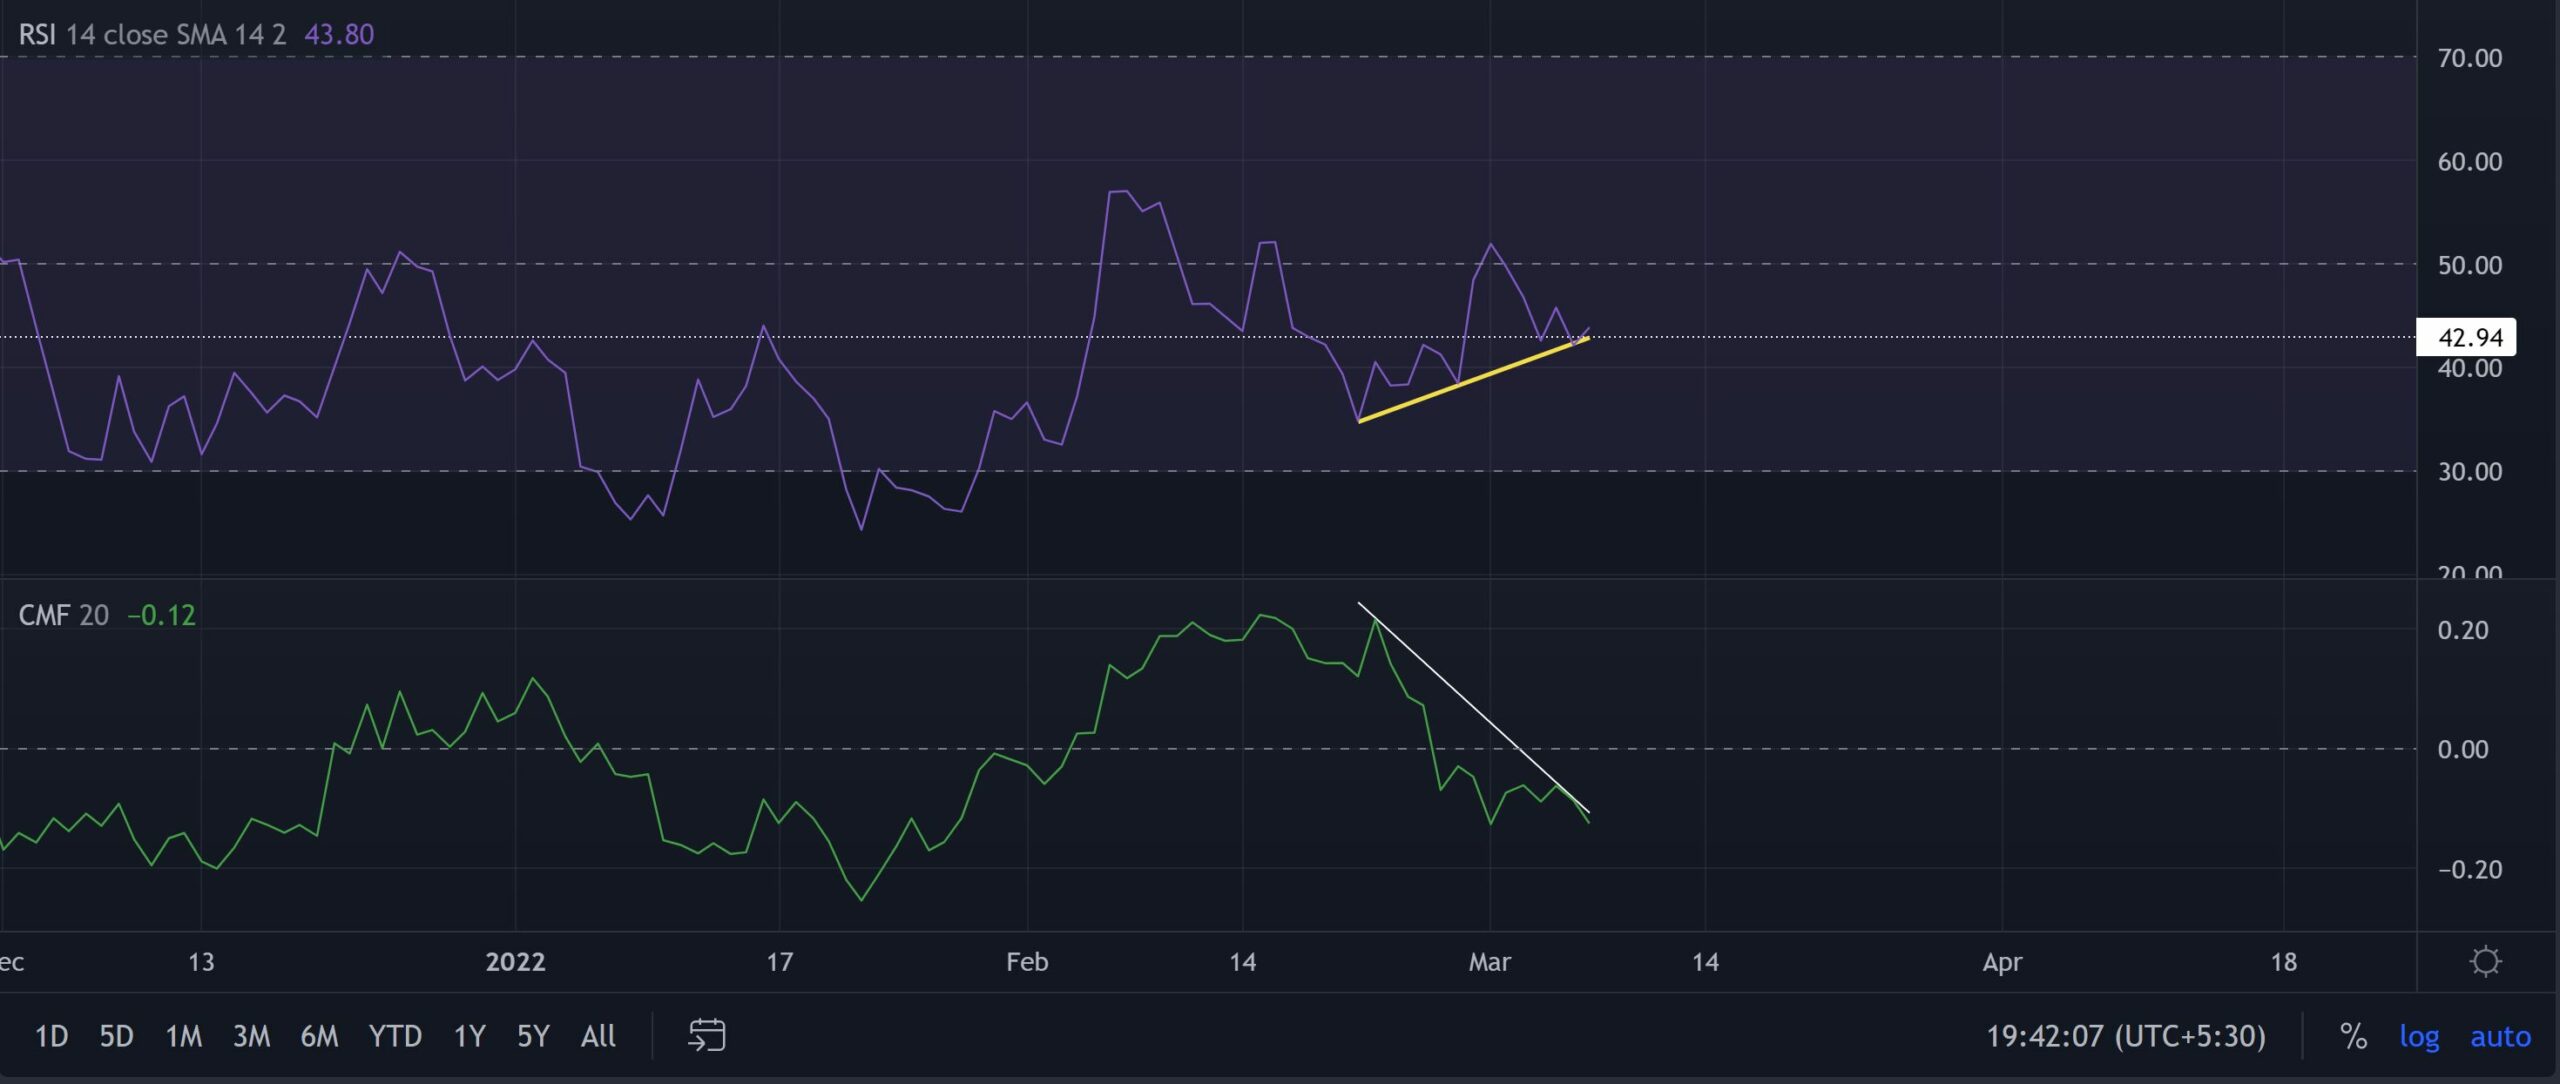
The RSI was in congruence with price as it endeavored to find a close above the 42-point level. Keeping in mind the previous retests on its trendline support (yellow), a test of its equilibrium in the coming days could be conceivable.
Nevertheless, the CMF plunged below the zero line in favor of sellers and reaffirmed the possibility of a continued squeeze phase near its POC.
Conclusion
As the buyers attempt to regain their edge, AXS eyed to settle in the $50-$53-range before being in a position to challenge the $54-mark. Meanwhile, the buyers needed to ensure the 78.6% Fibonacci support.
Moreover, the alt shares an 84% 30-day correlation with Bitcoin. Thus, keeping an eye on Bitcoin’s movement would be essential towards making a profitable move.


