Fantom: After a brief pullback, these are the odds of bullish sentiments returning

Disclaimer: The findings of the following analysis are the sole opinions of the writer and shouldn’t be considered investment advice
Over the past few days, Fantom has climbed strongly above the $2.75 area. It climbed as high as $3.35 but was rejected sharply. At the time of writing, a bearish reversal pattern was forming on the lower timeframes.
Could this see Fantom drop further, and would this shift Fantom’s trend?
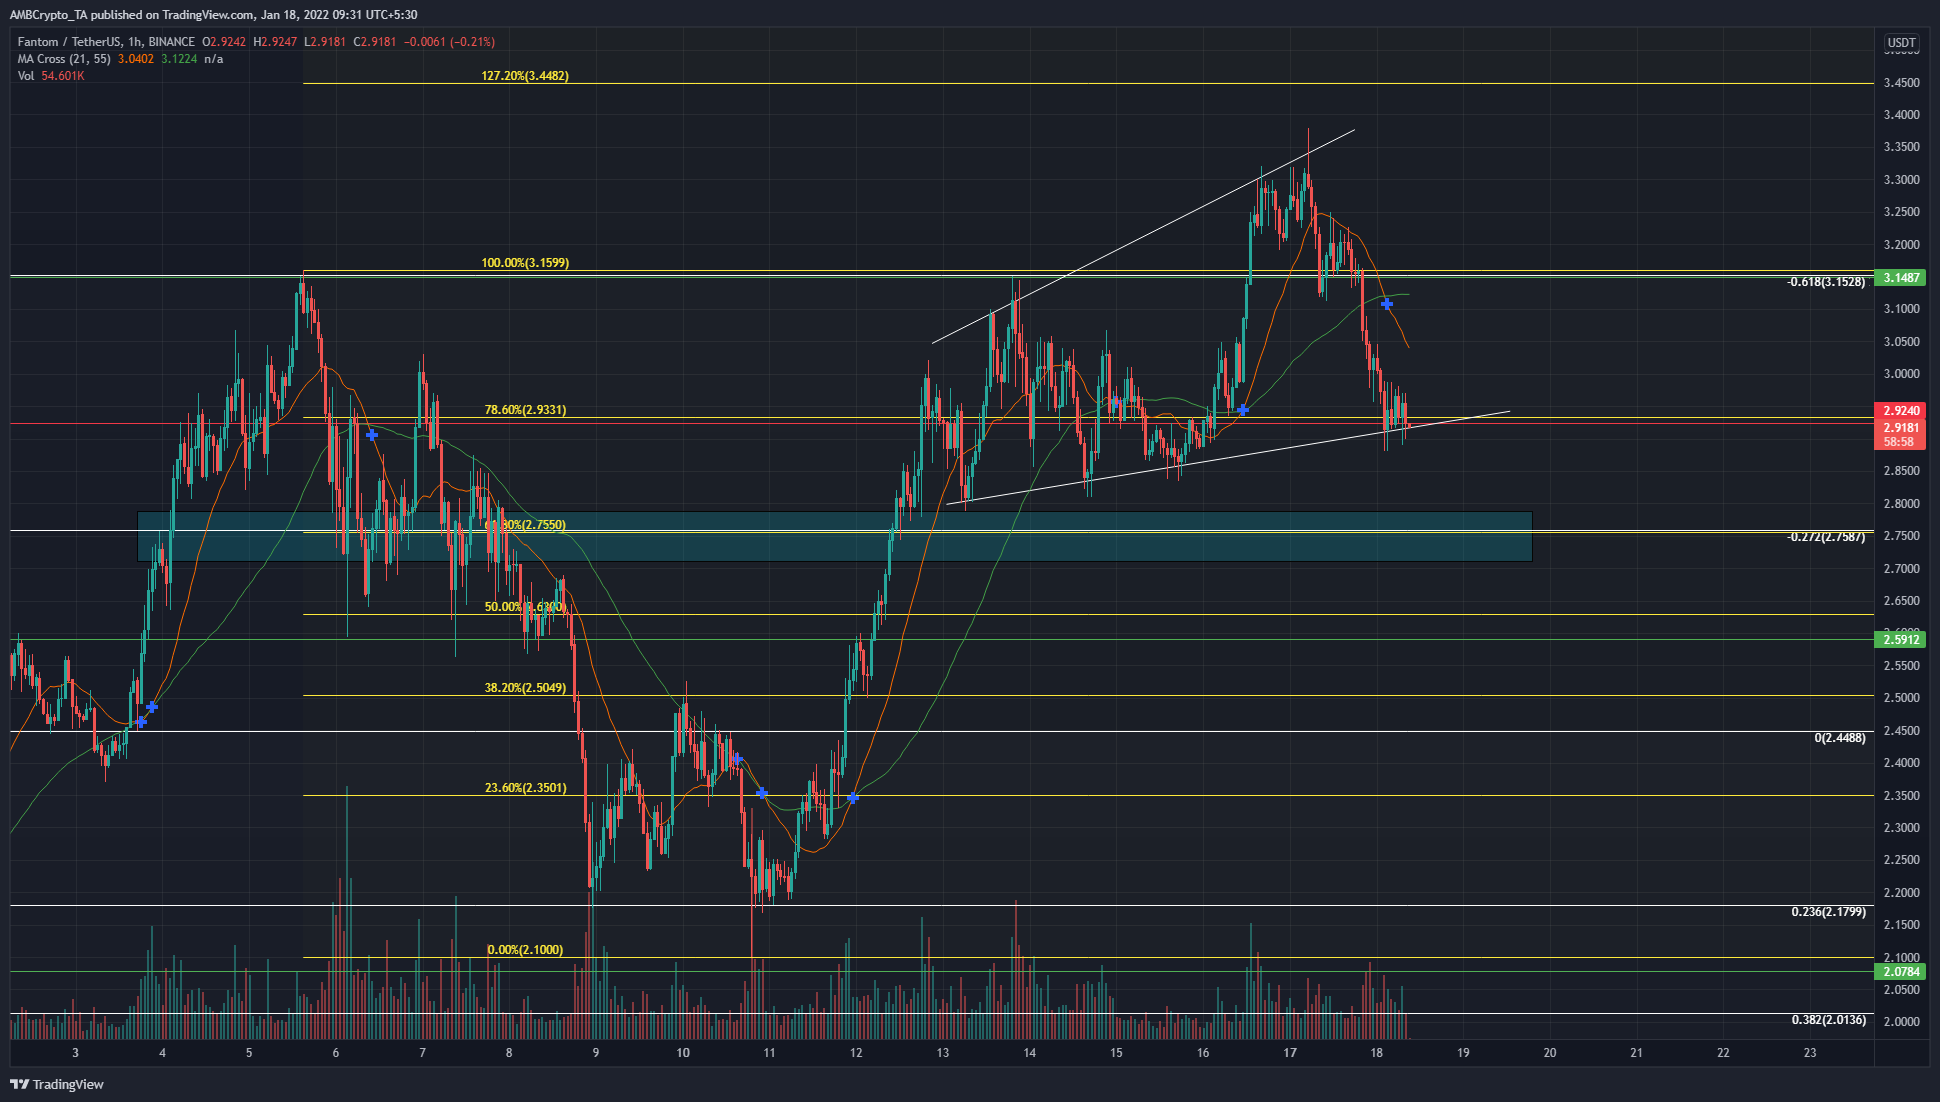
Over the past week, Fantom fell to its $2.2 lows, but it has rallied strongly since then. Over the past few days, the price broke the $2.92 level and flipped it to support. This level had confluence from two sets of Fibonacci retracement levels plotted. The short-term one (yellow) was based on the swing high at $3.15 and low at $2.1 and gave the $2.93 -level as the 78.6% retracement level for this move.
Thus, flipping the $2.92 level to support is an important step for the bears. The $2.75 area (cyan box) is also a pocket of liquidity that has been important recently.
Recently, the price formed an ascending broadening wedge pattern (white). This pattern can indicate the end of an uptrend, at least temporarily. A session close below the $2.92 support would likely see FTM retrace back to the base of the pattern at $2.82.
Therefore, it is likely that losing the $2.92 support would likely see FTM dip to $2.82, and possibly as far as $2.7. FTM has been volatile in the recent past even on lower timeframes and the market makers could aggressively hunt for liquidity before resuming the uptrend FTM has been on since late December.
Rationale

The MACD dropped below the zero line to indicate bearish momentum. The Accumulation/Distribution line has followed the price movement as it registered a pullback in the midst of last week’s upward trend. The 21-SMA (orange) crossed below the 55-SMA (green), a sign of bearish intent.
Conclusion
Fantom’s sharp drop from $3.3 was not a disaster for the bulls. The $3.3-$3.5 area has offered significant resistance in the past, such as in late October. A move downward could be seen for Fantom, and the $2.82-$2.7 area can be considered a buying opportunity.
Fantom has a tendency to be quite volatile as the price searches for liquidity, and another place where this liquidity could be seen is at $2.58 – A longer-term support level. Losing this level could see FTM’s trend shift again.