Fantom [FTM] will see a divergence and this is how it will play out

Disclaimer: The findings of the following analysis are the sole opinions of the writer and should not be considered investment advice
Fantom’s (FTM) price action refused to take a bullish stance while it remained constricted within the bounds of the 55 EMA on the daily timeframe.
The sellers have kept the EMA ribbons south-looking for quite a few months now. While a revival may be due, the current bearish flag setup may not play out in favor of the bulls.
At press time, FTM was trading at $0.3956 on the charts.
FTM Daily Chart
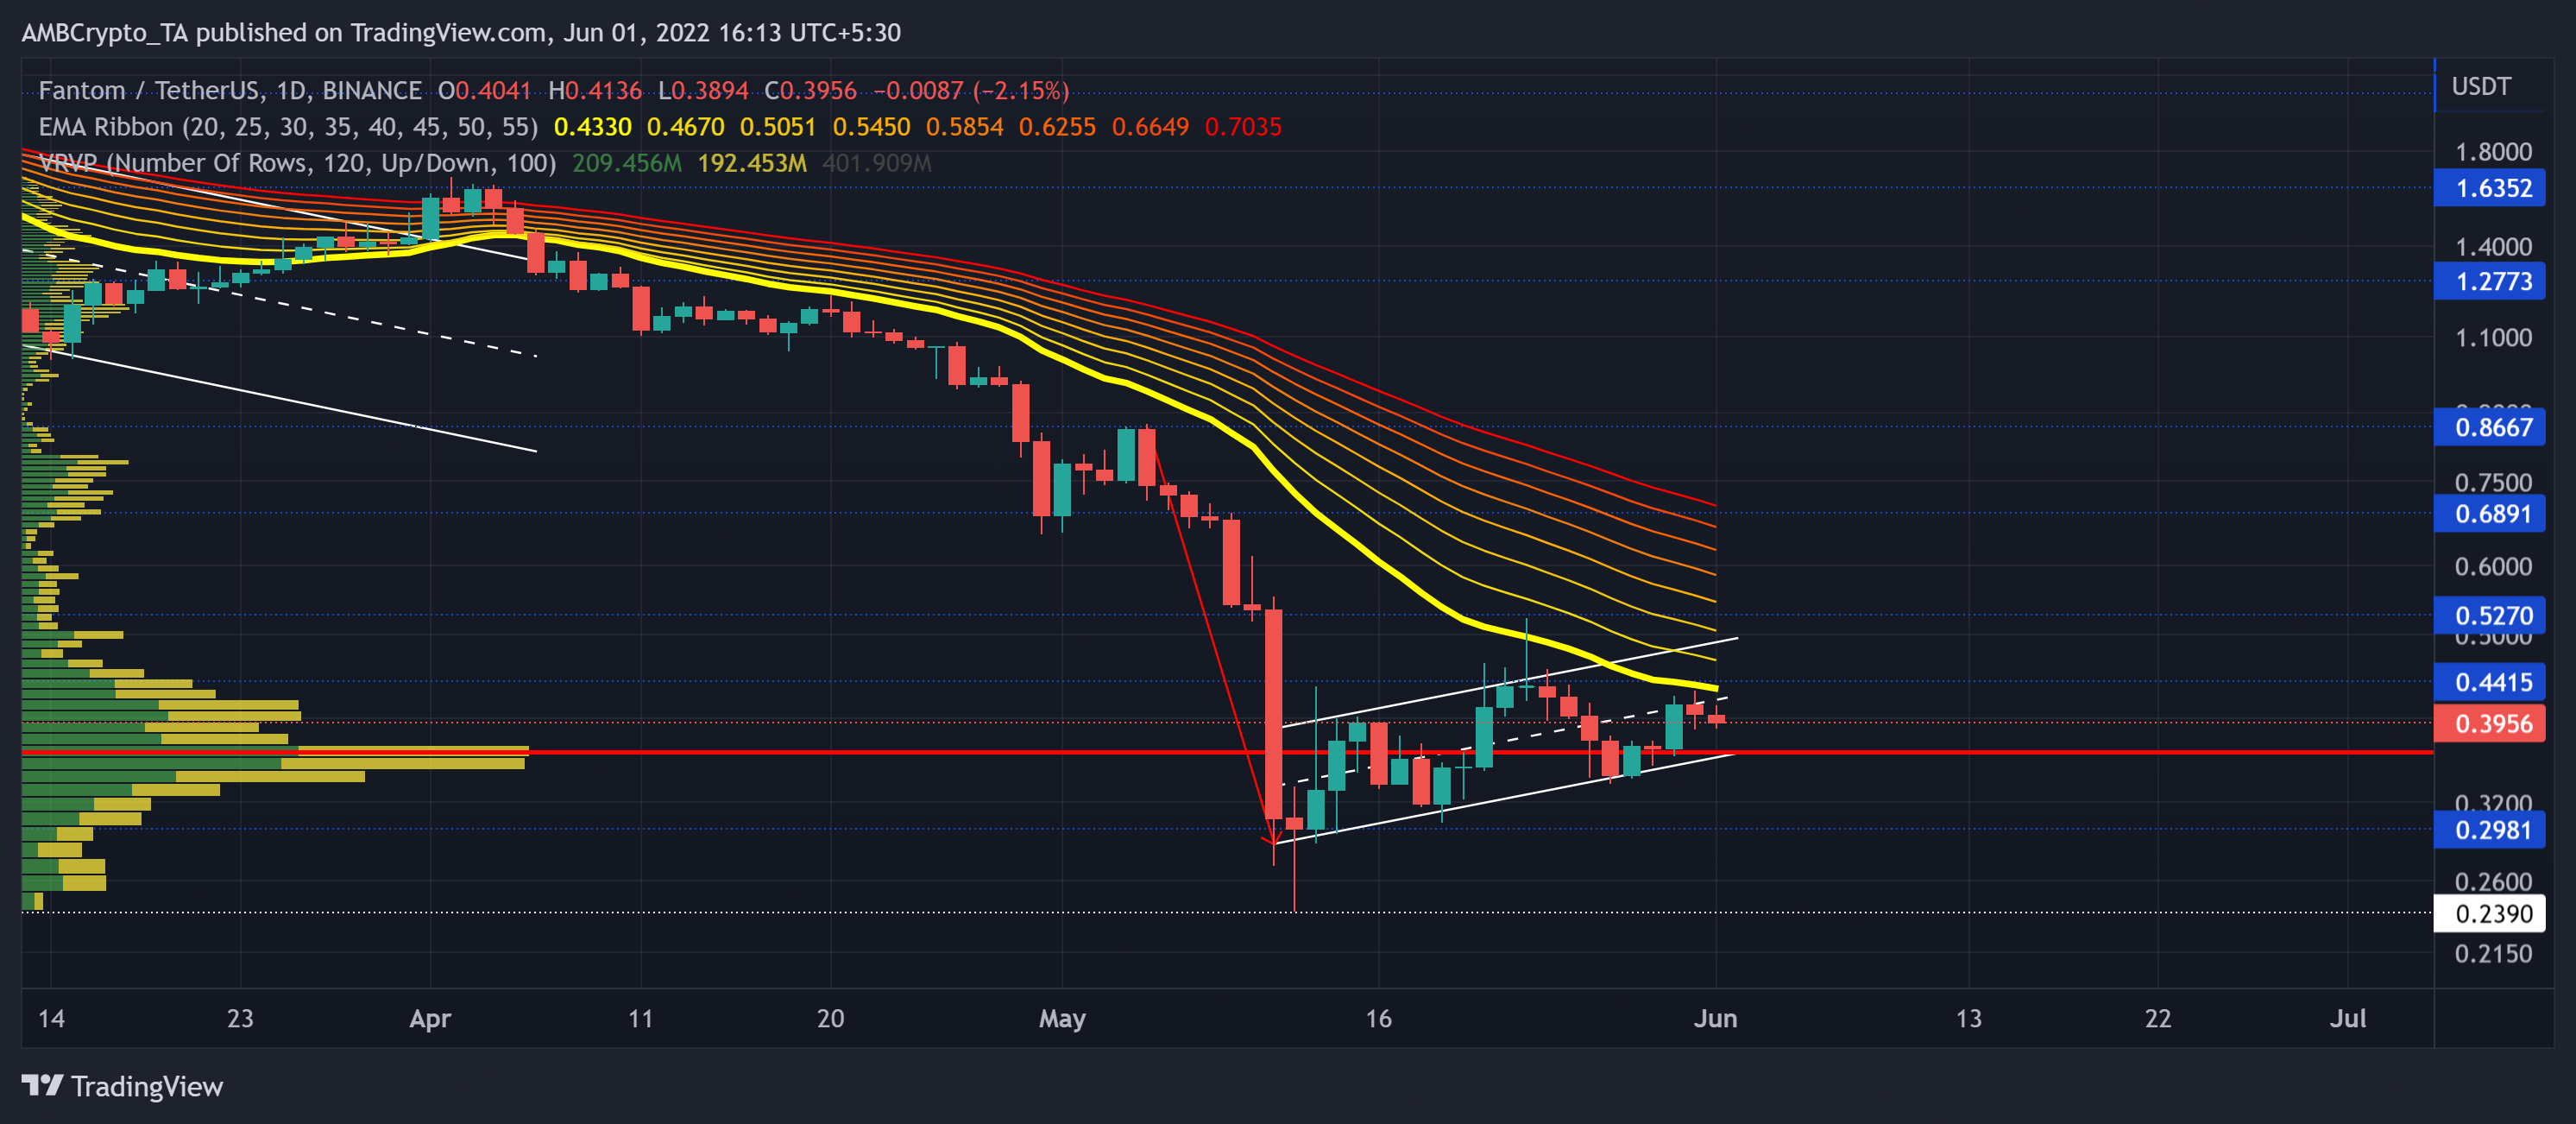
The bears have obviously not been dissatisfied with the FTM’s recent rallies. Sustained southbound pressure has forced the price below the limits of its EMA ribbons since its inception this year.
Since the alt nosedived from $2.1, the bulls finally found their ground at the $0.29-level. The digital currency lost 88% of its value (from its February highs) and hit its nine-month low on 12 May.
Over the last few days, FTM witnessed a steep flagpole alongside a bearish flag on the daily chart. With the price action approaching the Point of Control (POC, red) region, the altcoin saw short-bodied candlesticks and entered a compression.
A likely retest of the POC could extend FTM’s tight phase in the $0.35-zone. An eventual breach of the 20 EMA by the buyers would aid the alt’s efforts to test the $0.68-level and substantially ease the selling pressure.
Rationale
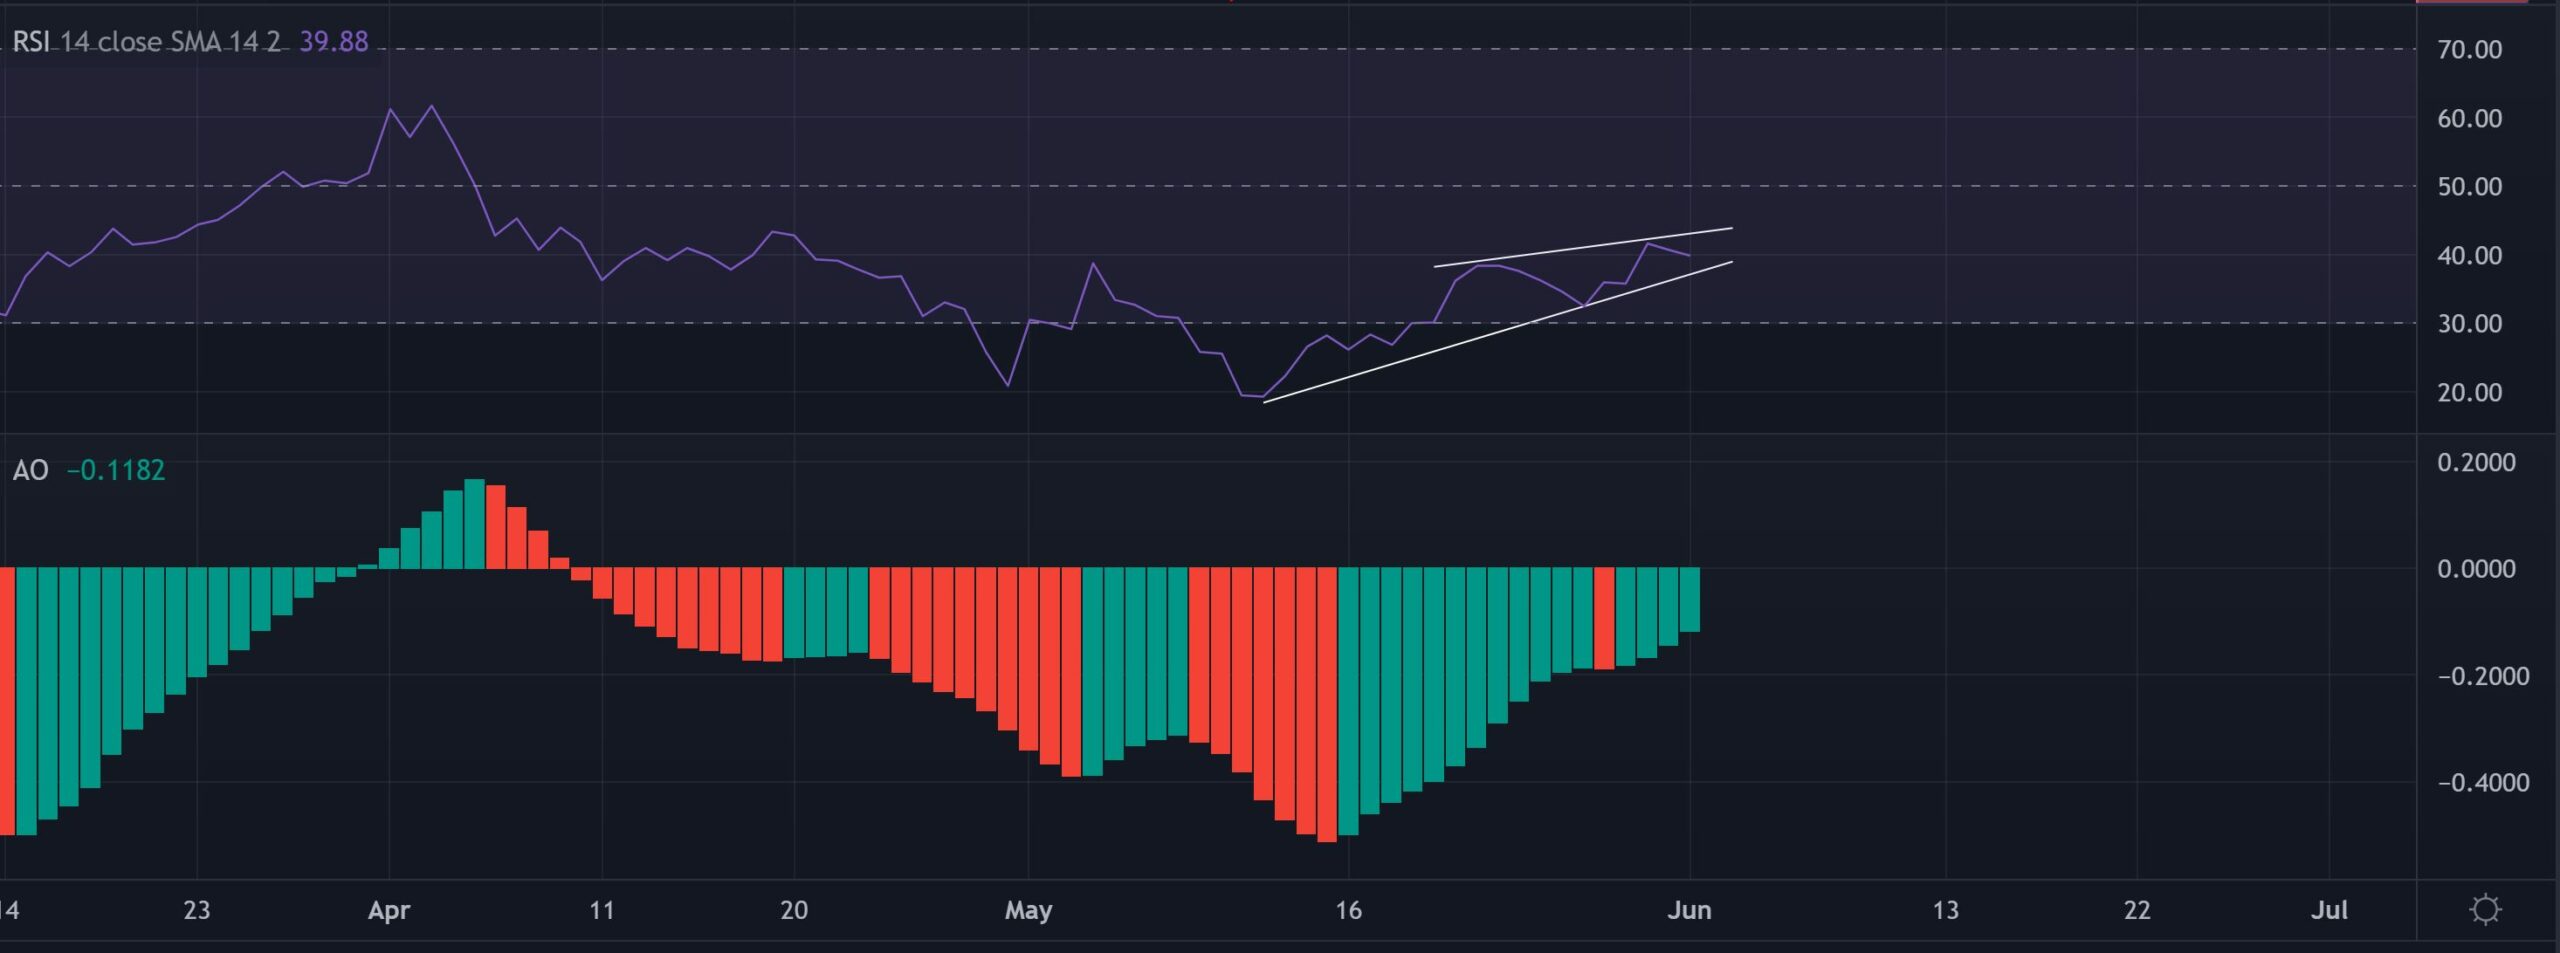
The Relative Strength Index (RSI) saw consistent growth on its troughs and peaks in its rising wedge oscillation. However, recent peaks have bearishly diverged with the price. A close below the wedge could lead the index back into its oversold region.
On the flip side, the Awesome Oscillator (AO) showed gradual improvements as it approached the zero-mark. Traders/investors must watch out for a close above the equilibrium for a reliable entry trigger to bag in short-term gains.
Conclusion
As the press time setup projected a bearish inclination, a close below the POC could lead FTM to retest the $0.29-level.
Thanks to the over-extended gap of the EMA ribbons, eventual buying pressure could negate this by finding a close above the 20 EMA. In this case, the take-profit levels could lie around the $0.68-zone.
However, FTM shares a staggering 95% 30-day correlation with the king coin. A close eye on Bitcoin’s movement would be imperative to make a profitable move.


