Fantom: How to long this inverse head and shoulders pattern

Buoyed by a broader market recovery, Fantom continued its ascent which kick-started on 27 October following a rebound from $2.8. Should FTM make headway towards the neckline of its head and shoulders pattern, further upside lay in wait after a successful breakout.
With spot volumes accumulating across exchanges, traders must keep a close eye on the chart in order to long FTM’s bullish pattern. At the time of writing, FTM traded at $3.28, up by 17% over the last 24 hours.
Fantom Hourly Chart
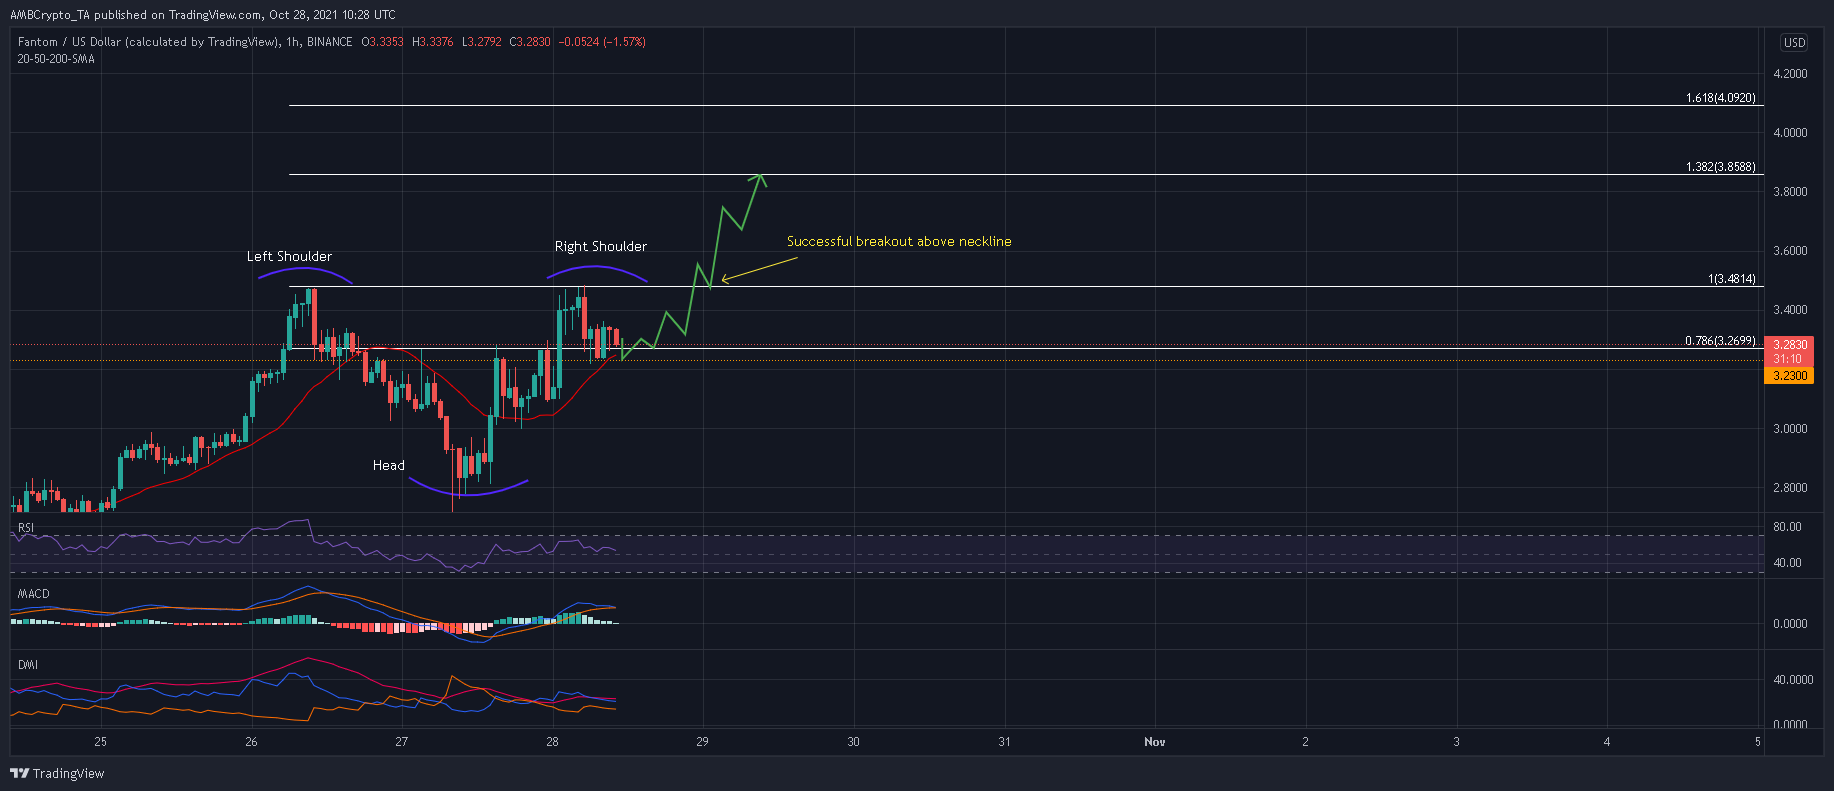
Fantom formed an inverse head and shoulders on the lower timeframes, following its decline to $2.8 and a subsequent pickup back towards $3.48. Now that the right shoulder completed formation, FTM needed to make ground back towards the neckline. Before doing so, the MACD’s potential bearish crossover was expected to invite some selling pressure into the market.
From there, bulls can target a comeback at the neckline by responding at the confluence of the 78.6% Fibonacci level and the 20-SMA (red). Once FTM decisively closes above $3.48, bulls can extend their reach towards the 138.2% Fibonacci level ($3.85). The 161.8% Fibonacci level ($4.09) would be more of a mid term target, achievable over the coming days.
To negate this outcome, bears would need to force a close below $2.3, following which the market would be exposed to $3.07 and $2.8 support areas.
Reasoning
Now the bulls have presented the RSI from declining below 50, which was a positive sign. This indicated that buyers were putting up a strong fight to keep FTM within a bullish-bias.
The Directional Movement Index also confirmed with the RSI’s bullish stance. However, the MACD was expected to generate some downwards pressure as the fast-moving line (blue) eyed a break below the Signal line (orange).
Conclusion
FTM was expected to head towards the 78.6% Fibonacci level and 20-SMA (red) due to a weakening MACD. However, bulls could respond strongly at this confluence and trigger a comeback towards $3.48. From there, an upwards breakout would set FTM on course towards the 138.2% Fibonacci level. Meanwhile, traders can long FTM once the price puts a leg above $3.48. Take-profit can be set at $3.85 and stop-losses at $3.22.


