Fantom slides below three week range, here’s what traders can expect

Disclaimer: The information presented does not constitute financial, investment, trading, or other types of advice and is solely the writer’s opinion.
- FTM falls below $0.216 and is likely headed much lower
- Spikes in exchange inflows suggest rising selling pressure
Fantom [FTM] has not shown much volatility over the past two weeks. For the most part, the price bounced between the $0.218 and $0.23 levels, which stood just under 5% apart. In a market used to far greater volatility, trading FTM might not have been as interesting recently.
Here’s AMBCrypto’s Price Prediction for Fantom [FTM] in 2022
This changed when the price dropped decisively below the support level of $0.216 a couple of days ago. This came at a time when Bitcoin slipped from $19.6k to $19k, but the rest of the market saw liquidations galore. Will the losses continue for both Bitcoin and Fantom?
The short-term range is broken and shorting opportunities can arise
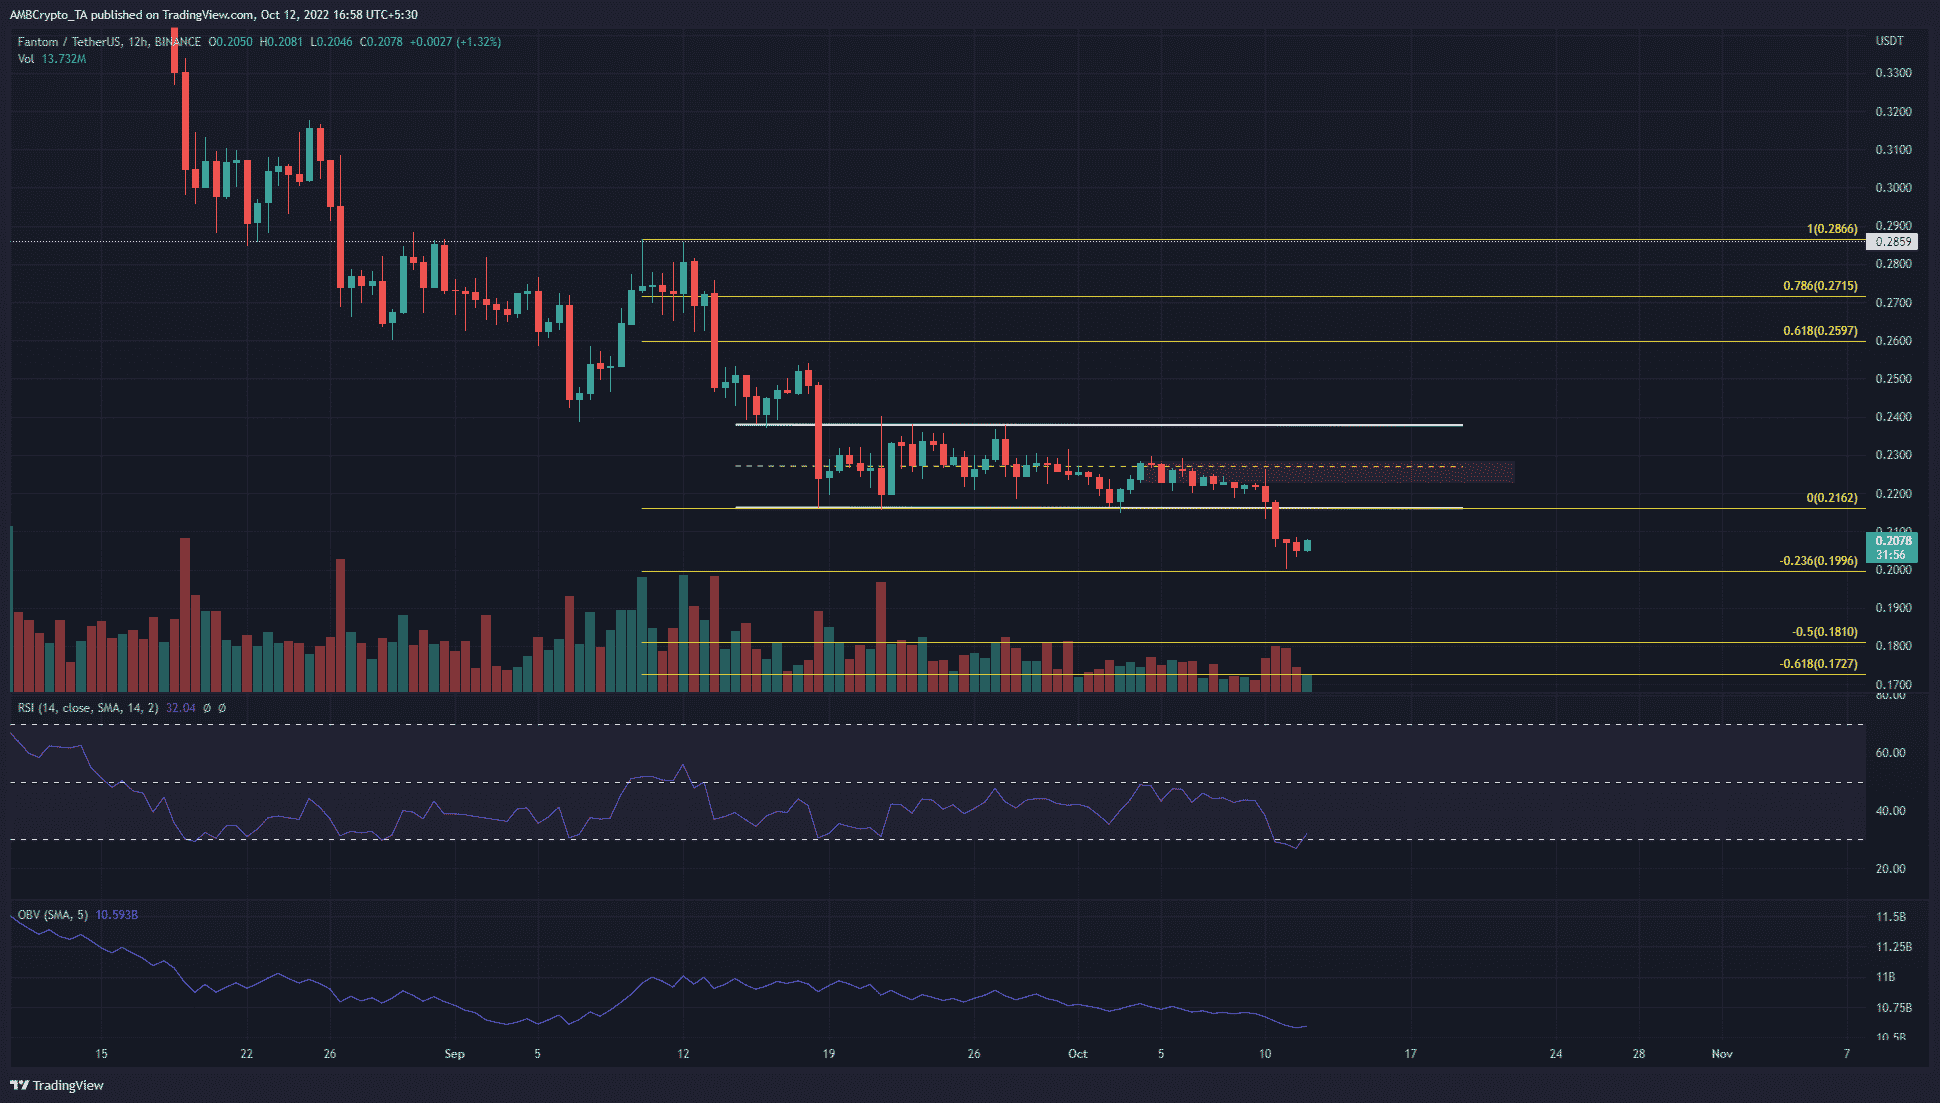
The 12-hour chart showed a clear downtrend for FTM in August and September. The past three weeks saw the price form a range (white) between $0.238 and $0.216. The mid-point of this range lay at $0.227, and has acted as resistance throughout October.
Hence, the trend was clearly bearish and a trade taken along with the trend would be more likely to succeed. With Bitcoin barely holding on to the $19k support as well, the next week or two could see a sharp move downward for FTM.
Short sellers can look to open a position if FTM retests the $0.216 level, which were the former range lows. A set of Fibonacci retracement and extension levels (yellow) showed $0.1996, $0.181 and $1727 could serve as support levels, and can be used by short sellers to take-profit.
The Relative Strength index (RSI) on the 12-hour chart has been below neutral 50 since mid-August. The On-Balance Volume (OBV) has also been in a downtrend over the past month, to highlight selling volume was greater than buying.
Exchange inflows and supply hinted at strong selling

The past three months have been quite rocky for FTM. The relatively rapid gains from July to August were completely retraced, and a downtrend was in full swing. This was a token that had been trading above the $1 mark in April. Its remarkable losses in the months since then already highlighted just how strong the sellers have been.
This fact was highlighted once more in late September. The exchange inflow metric saw a sharp spike. Correspondingly, the supply held by exchange addresses also shot up. This supply held has been on the rise over the past two weeks. Therefore, more and more sellers were likely sending their tokens to exchanges in order to cash out.