Flustered Bitcoin investors could expect a quiet start to the week thanks to…

- BTC’s MVRV Index indicated a possible market bottom
- Number of Addresses Holding 0.01+ Bitcoins reached an ATH
The current cycle in the crypto market was seen favoring sellers. This was the reason for most of the crypto market bleeding red. The market leader Bitcoin [BTC] was also hit as its price declined by 21% over the last week, according to CoinMarketCap.
At press time, the coin was trading at $16,548.29 with a market capitalization of $316,701,863,540.
____________________________________________________________________________________________
Read Bitcoin’s [BTC] price prediction for 2023-24
____________________________________________________________________________________________
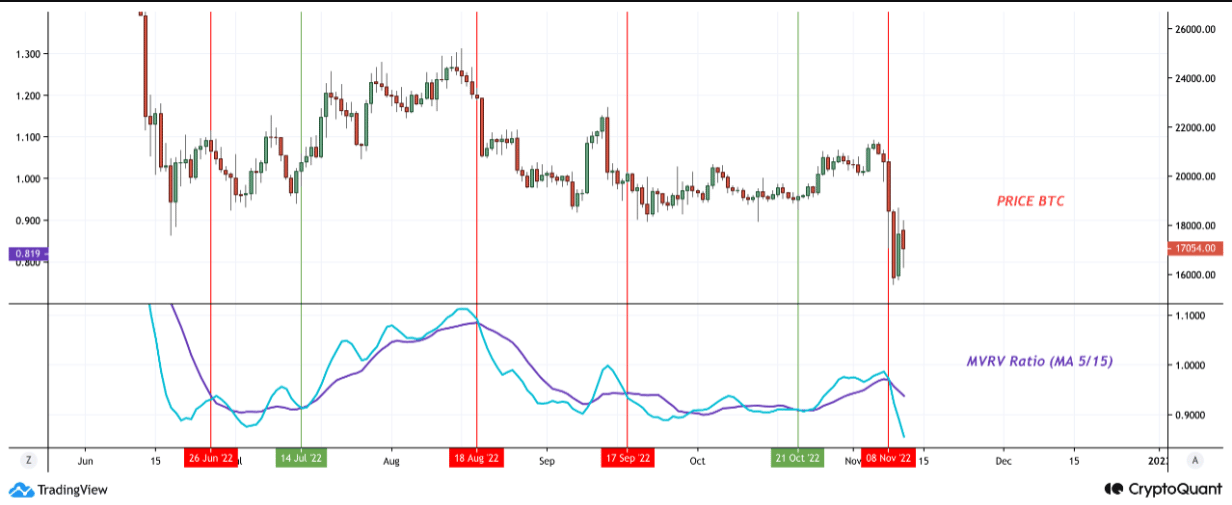
However, BTC investors could take a small breather as a trend reversal could be on the cards. According to Achraf elghemri, an analyst and author at CryptoQuant, Bitcoin’s Market Value to Realized Value (MVRV) showed an interesting movement that may lead to a trend reversal in the days to come.
Good days will be back soon
In his analysis, elghemri pointed out that the MVRV index indicated an undervalued rate. There was little speculative bounce due to the severity of the decline, indicating a possible market bottom. Thus, investors could hope for a price increase.
Several other on-chain metrics also revealed a similar possibility. For example, CryptoQuant’s data revealed that BTC’s SOPR was green. This indicated a possible market bottom as more investors were selling at a loss. BTC’s exchange reserves were also low, which suggested less selling pressure.
Interestingly, according to Glassnode, the number of addresses holding 0.01 or more Bitcoins just reached an ATH of 11,032,070. This was a positive development, as it reflected the confidence of investors in the king coin.
📈 #Bitcoin $BTC Number of Addresses Holding 0.01+ Coins just reached an ATH of 11,032,070
View metric:https://t.co/oyguxpaA2y pic.twitter.com/5LoNYekxgi
— glassnode alerts (@glassnodealerts) November 13, 2022
Are these enough for a BTC pump?
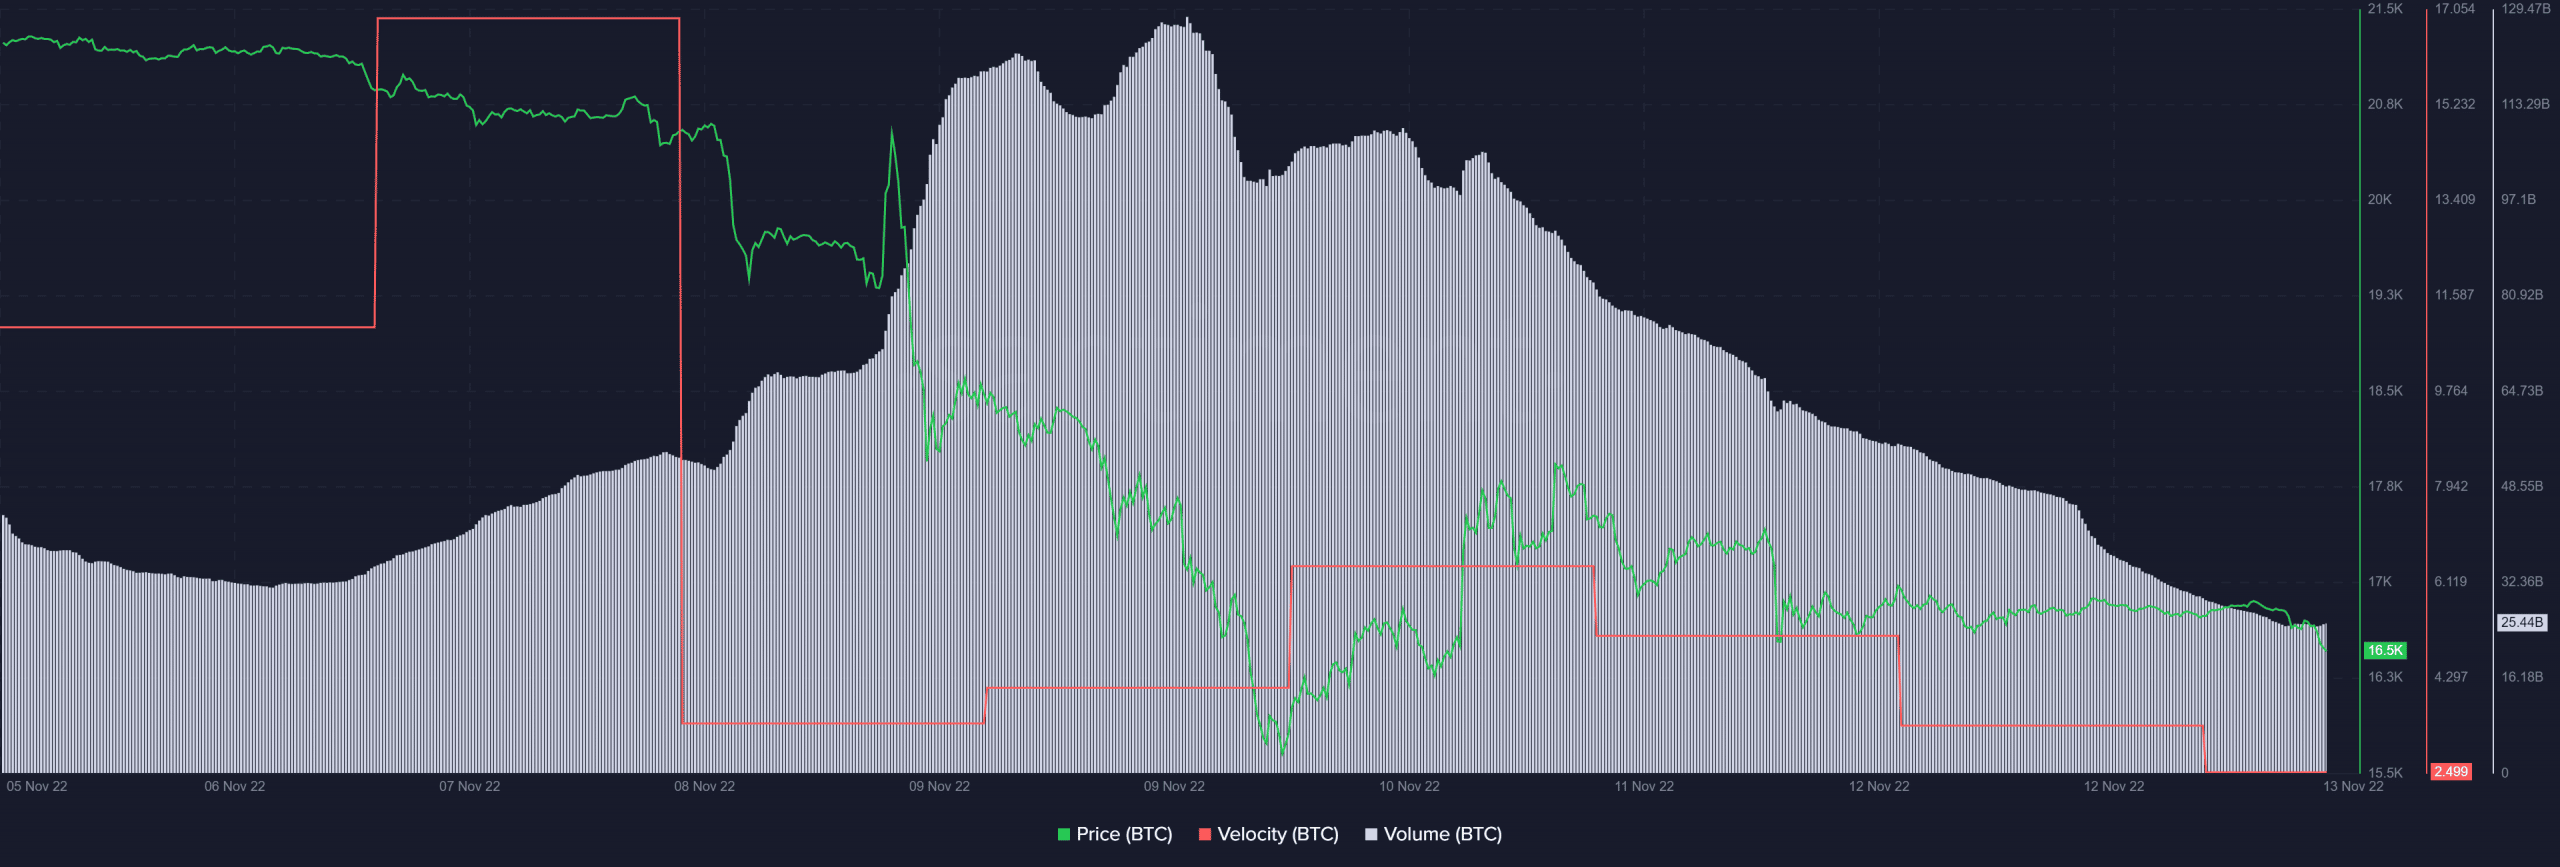
Though these metrics looked pretty promising for BTC, nothing can be said with certainty given the current volatility and unpredictable nature of the crypto market. BTC’s velocity took a nosedive over the last week, which was a negative signal. The same was true for BTC’s volume, which also registered a sharp decline.
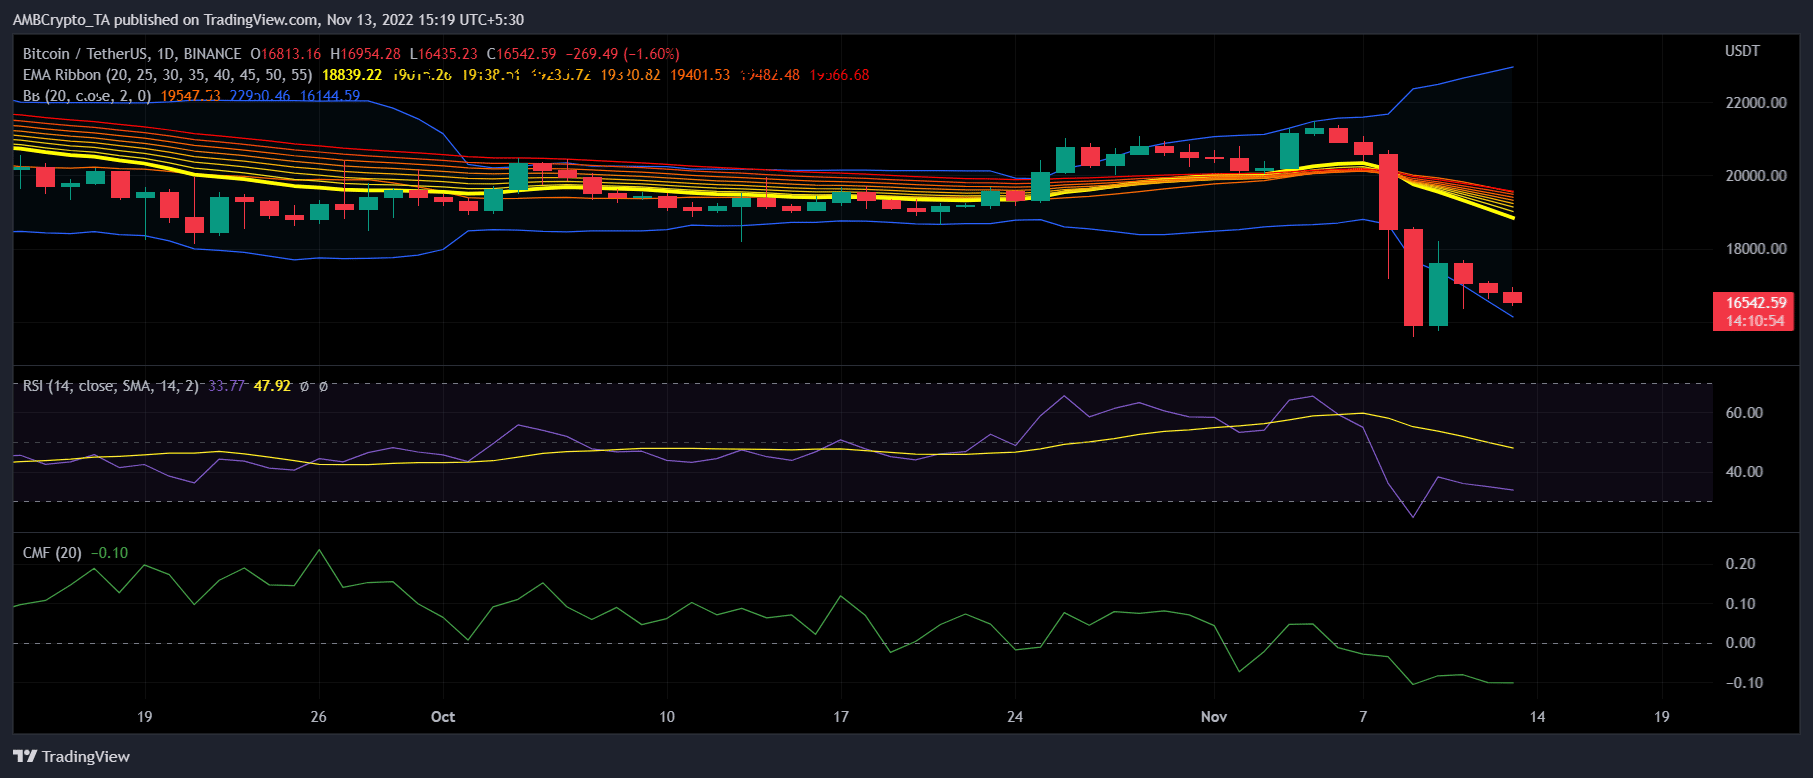
Bitcoin’s daily chart also gave a bearish notion. The Exponential Moving Average (EMA) Ribbon, for example, revealed that the bears had the upper hand as the 20-day EMA was below the 55-day EMA.
The Relative Strength Index (RSI) and Chaikin Money Flow (CMF) were also resting below the neutral mark, which was also a negative signal. Lastly, the Bollinger Bands (BB) revealed that BTC’s price was in a high volatility zone, further increasing the chances of a price plummet.