For Decentraland [MANA] traders the next major support levels lie at…

Disclaimer: The findings of the following analysis are the sole opinions of the writer and should not be considered investment advice
MANA, the token of Decentraland, has been a poor performer on the price charts since early February. The rallies of late January and late March measured 71% and 25% respectively but were still unable to break the bearish technical structure and kickstart a bullish trend.
The downtrend of Bitcoin in recent weeks has also affected MANA badly, and the price stood at the $1 mark as the market participants waited for the next strong move to begin.
MANA- 1 Day Chart
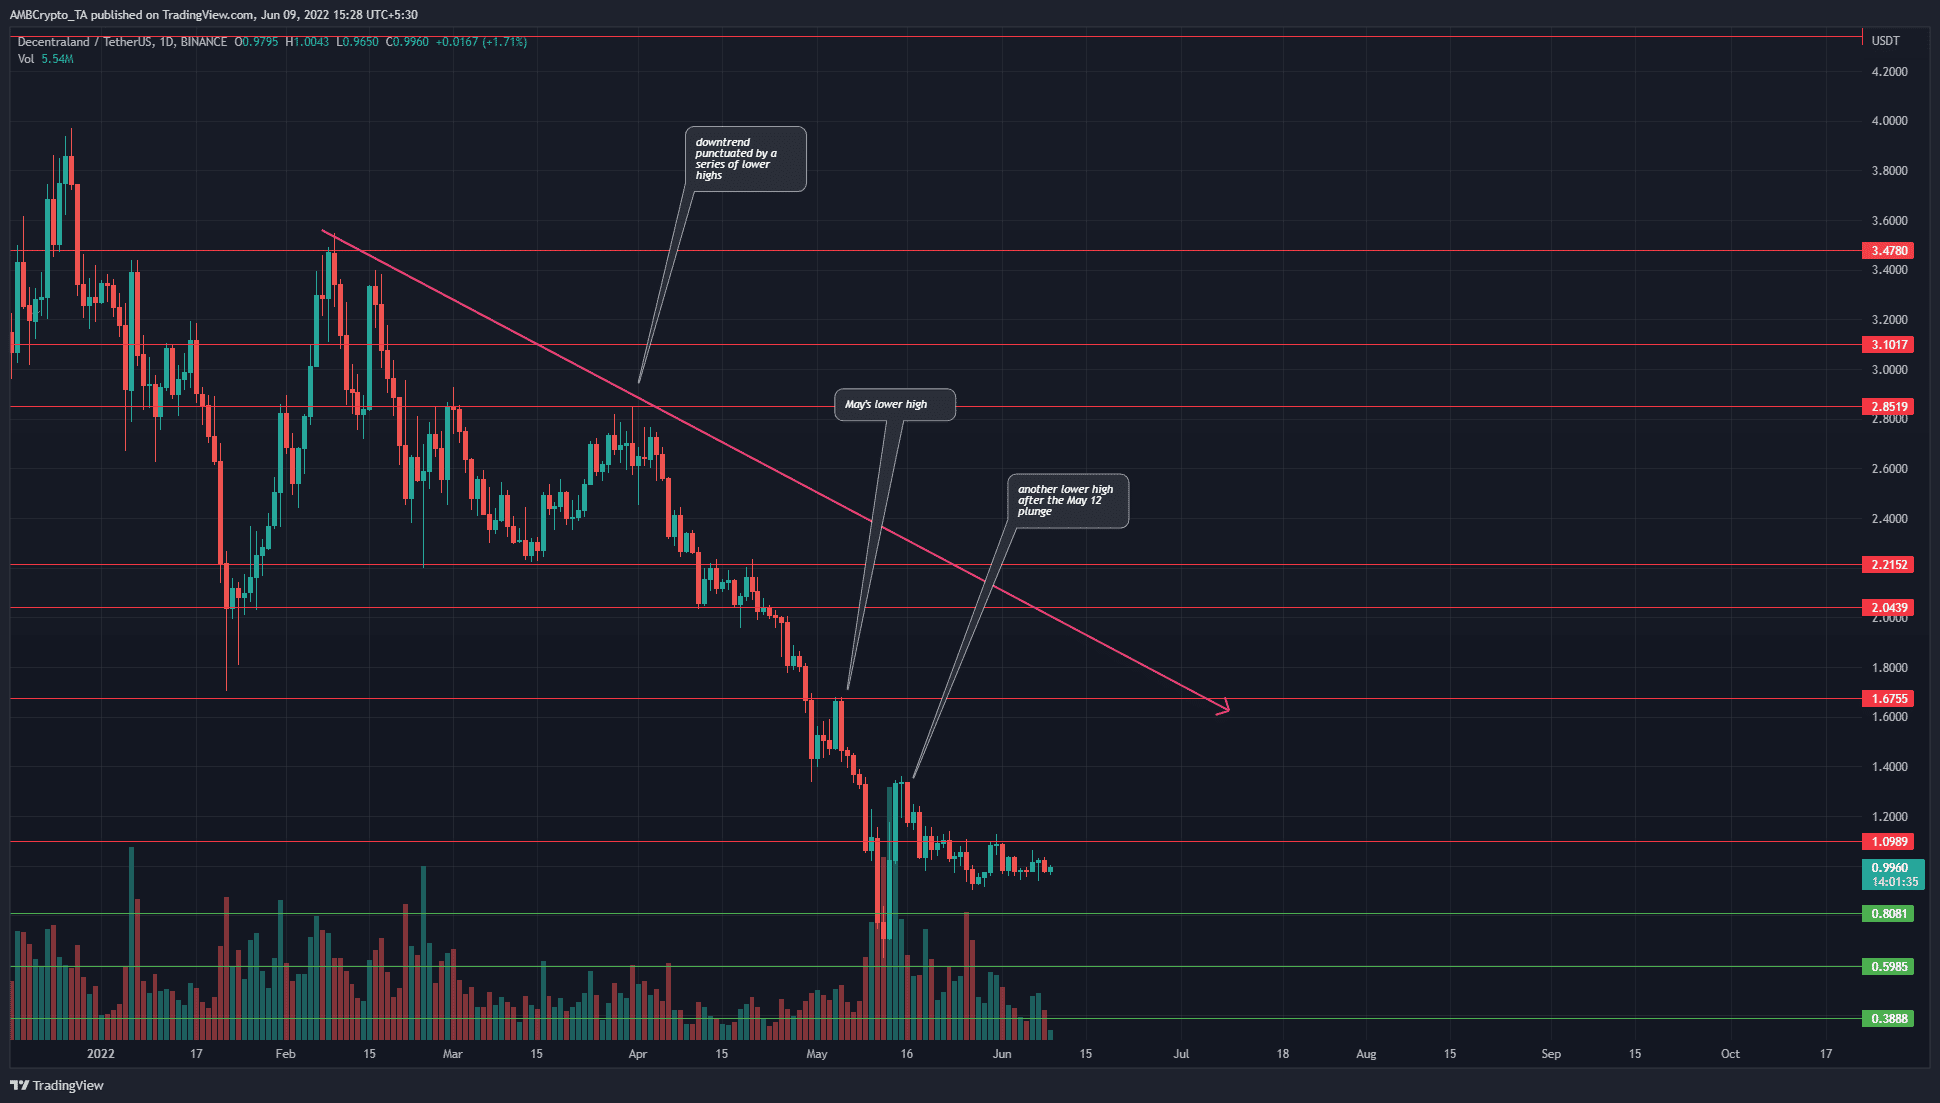
The downtrend has been in play since late November, but it did see a sharp rally in late January and early February. Following this rally, the price resumed the steady downtrend from November once again and formed a series of lower highs.
In April and May, the price failed to hold on to the $2 level and has slipped sharply to fall as low as $0.629 on 12 May. Later the same week, the price jumped to $1.4, to retest a lower low from late April at $1.4.
Therefore, resistances are strong, and no lower highs from recent weeks have yet been broken. Moreover, the price slipped beneath the $1.09 support as well and retested it as resistance in June.
The bears remain dominant on the charts, and a drop below the psychological $1 level could see MANA drop to $0.8 and even lower.
Rationale
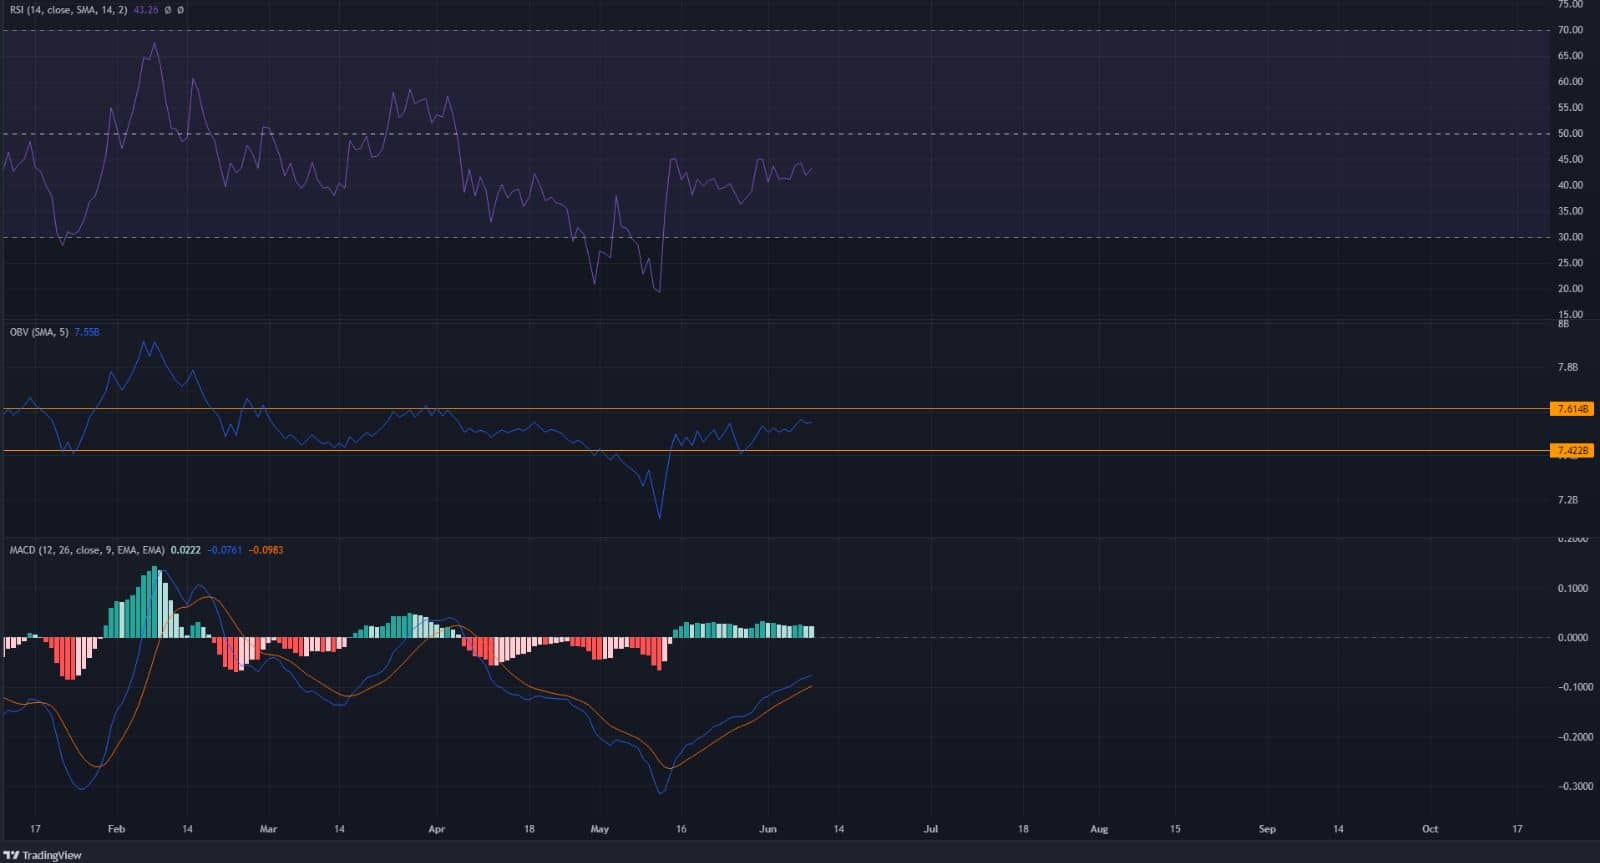
The indicators showed strong bearish momentum in progress. The RSI was beneath neutral 50 and has been for the most part since late February. The MACD has also been beneath the zero line since then, to show that the prevailing trend was bearish.
The MACD formed a bullish crossover in bearish territory three weeks ago and therefore showed a pullback in progress and not a shift in momentum to bullish.
The OBV had two levels of importance, and these two levels have been defended as both support and resistance since mid-February. There was a sharp dip beneath this level in May, but the OBV climbed back above. If it does slip beneath the lower level again, it could be an early sign of intensifying selling pressure.
Conclusion
The trend was strongly bearish, and the $0.9-$1 area has acted as support in the past two weeks. The next major support levels lie at $0.8 and $0.6.


