Gala offered a shorting opportunity on a recent bounce, but the downtrend…
Gala had held on to the $0.432 level of support all through December, even though it saw weaker and weaker bounces off the support level. Buyers finally capitulated in early January, and selling pressure intensified once more. The charts indicated a strong bearish outlook for Gala. It is not uncommon for altcoins to rally strongly for a few weeks before they retrace close to 80% of those gains. Some coins remain relevant in the market and consolidate for a few weeks before recovery. Could Gala be one of those coins? Where would a likely consolidation lie?
GALA- 1D
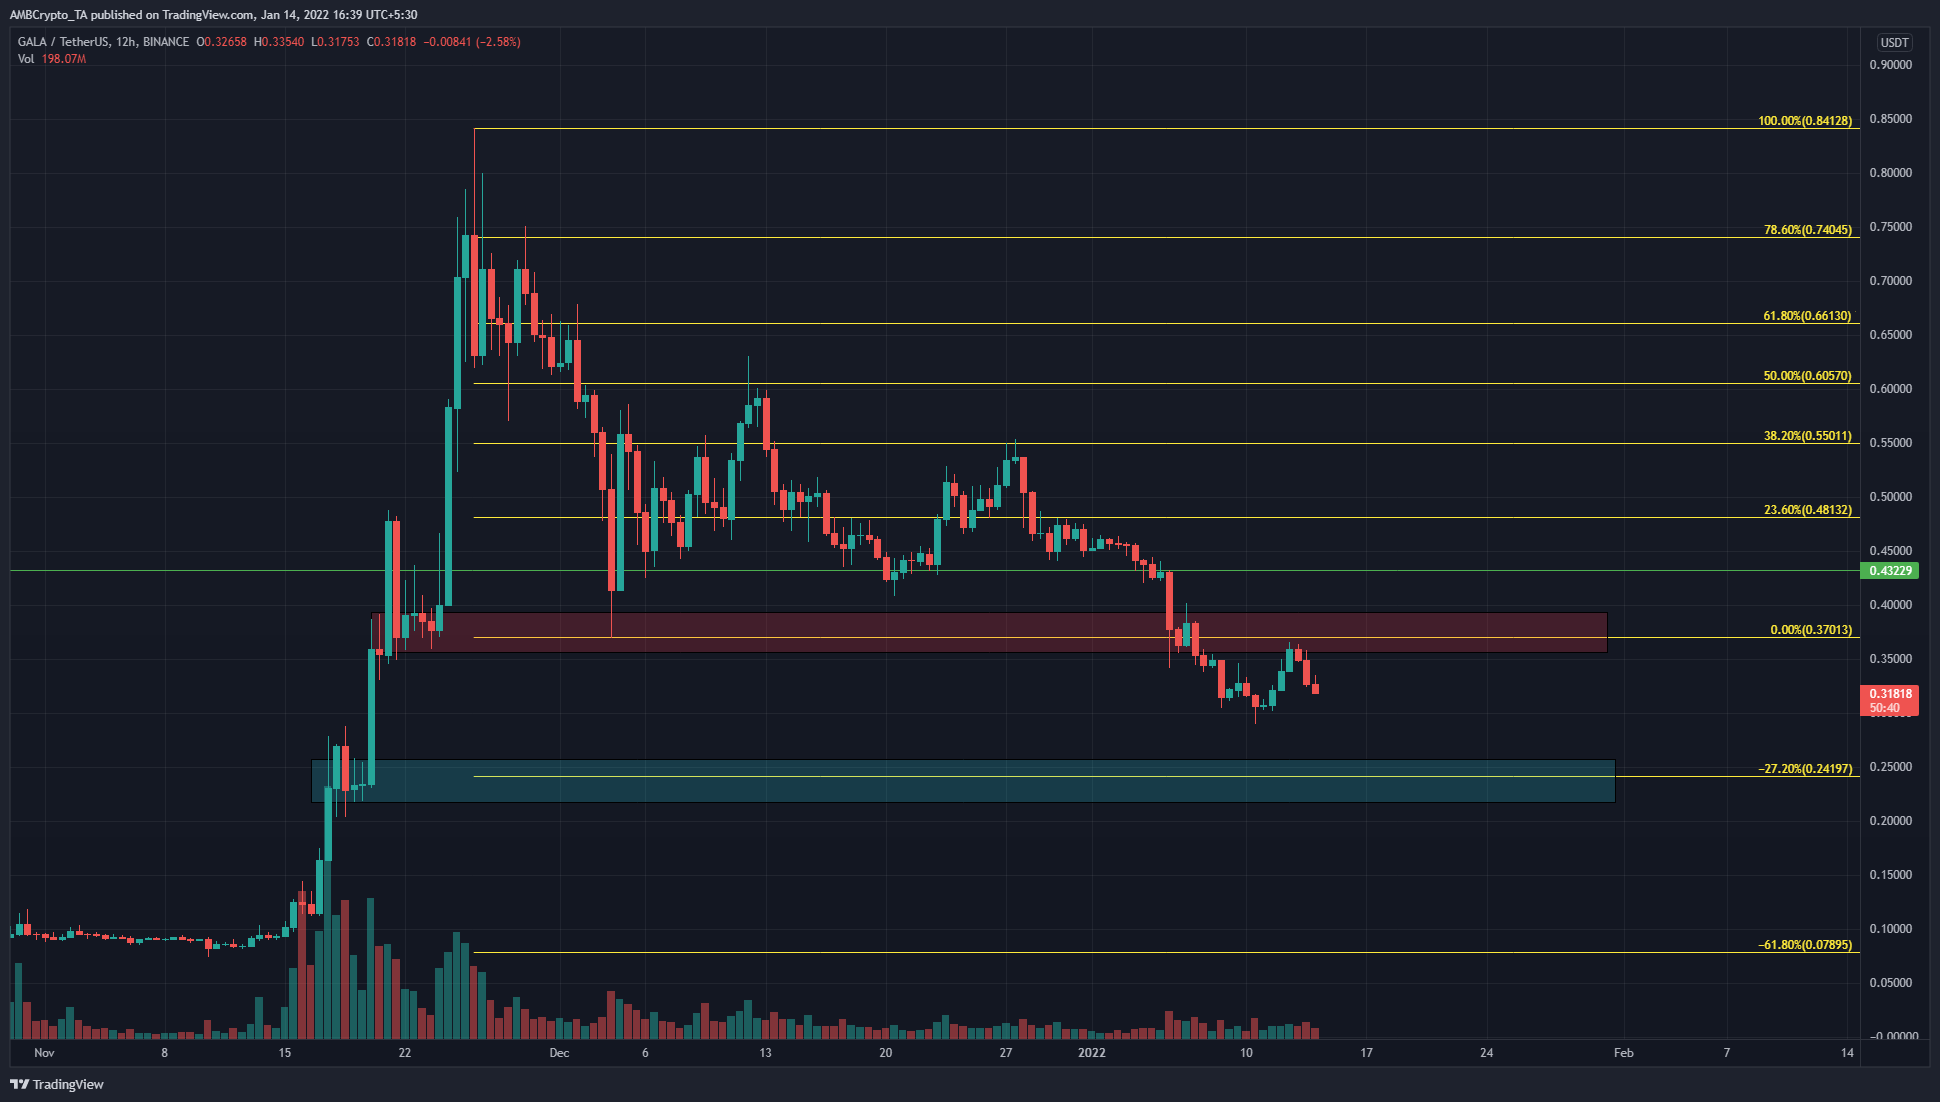
The move from $0.841 to $0.37 was used to plot Fibonacci retracement and extension levels (white). Alongside these levels, a key level of support at $0.432 was identified, a level buyers had defended throughout December.
At the time of writing, the price found some liquidity in the $0.37 area (red box), the December lows where buyers hoped for a bullish reaction. It was also an area where the price rallied strongly from in late November. However, the buyers were exhausted, and the price crashed straight past this area to visit $0.308 lows. It bounced to retest this area, confirming its flip from demand to supply.
Another area of demand was seen at $0.24 (cyan box). This area also had confluence with the 27.2% extension level at $0.241.
After the failure of $0.37 to hold, it was likely that the next few days, or weeks, would see GALA drop to test the $0.241 area in search of buyers.
Rationale
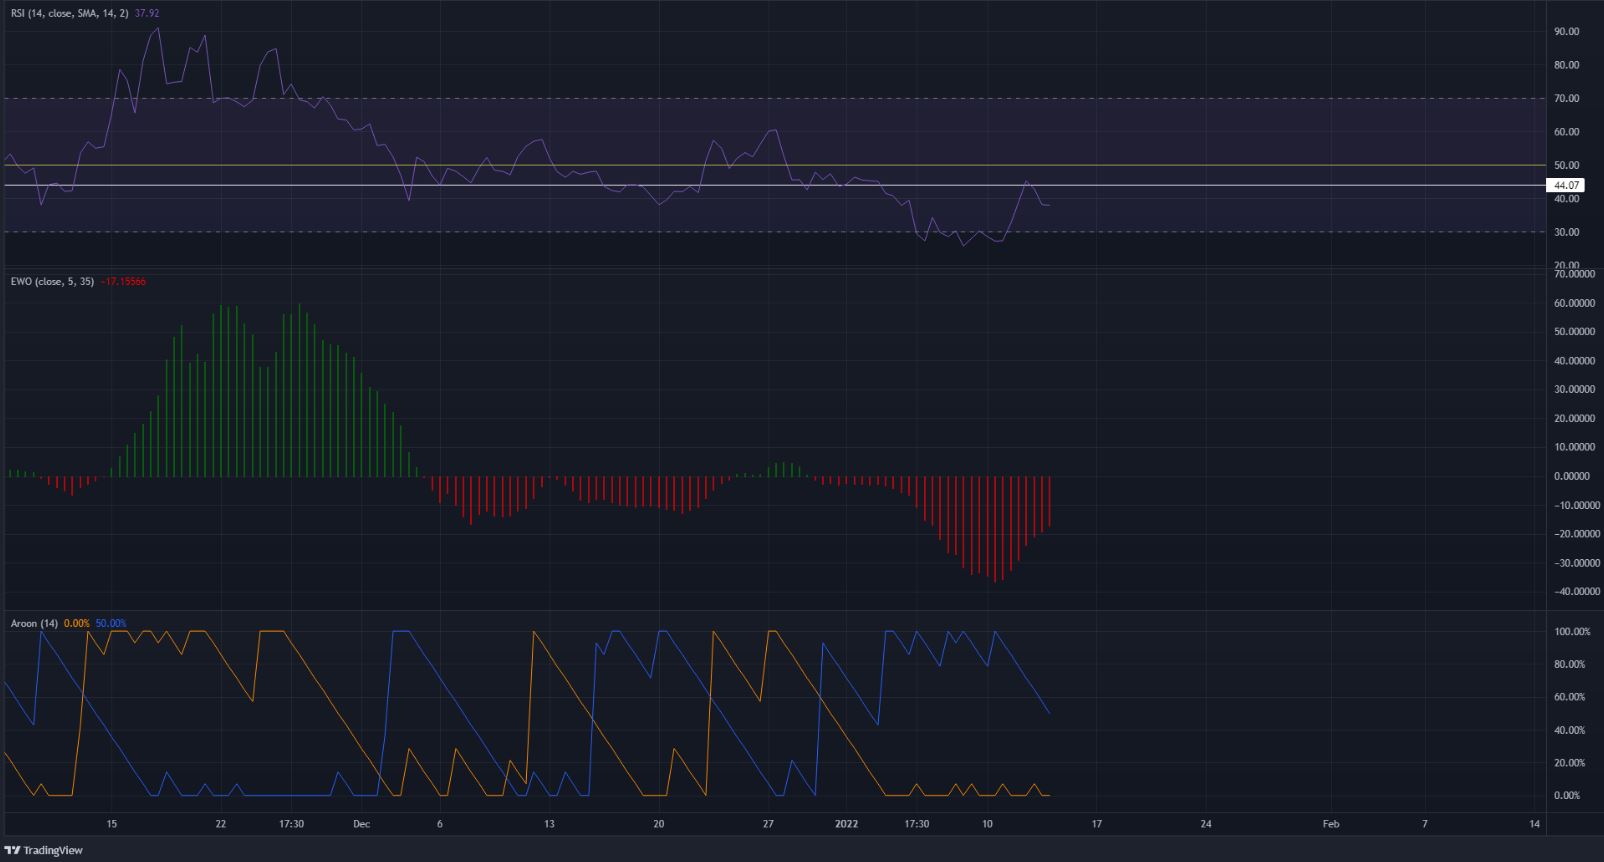
The RSI on the 12-hour chart was rejected from the 44-level and was below 40, at the time of writing. In the past, the RSI below 40 generally saw strong bearish pressure on GALA. The Aroon indicator also showed a strong bearish trend in progress over the past couple of weeks.
The Elliot Wave Oscillator was based on the difference between the 5 and 35-period SMA, and on higher timeframes, a divergence on this indicator and the price could indicate a reversal.
Therefore, if the EWO formed a higher low in the coming weeks, and GALA was at or near the $0.24 area (higher low on the indicator but lower low on the price, a bullish divergence) then it would likely be an indication that buyers were beginning to reverse the trend.
Conclusion
Gala was in a strong downtrend, and the retest of the former demand zone offered a good opportunity to short. Any short positions from this area can look to book profits at $0.3 and $0.24.


