Going short on Solana [SOL]? Here’s what you need to know
![Going short on Solana [SOL]? Here's what you need to know](https://ambcrypto.com/wp-content/uploads/2022/12/scott-jiles-0VqqAa31gUk-unsplash-scaled-e1672374509939.jpg)
- SOL was in a highly bearish structure.
- The price could fall below $9.43 and settle at $8.12 or $5.99.
- However, a breakout above $10.74 would invalidate the bearish bias.
Solana [SOL] still needs to overcome the FTX debacle. Its FUD remained strong at press time, undermining the once-thriving asset’s performance. According to Santiment, SOL’s 70%+ loss could be related to flattening development activity.
📉 #Solana is now down 73% in the past 8 weeks. The #FUD is strong toward the once thriving asset, but there appears to be some pretty good justification with development activity coming to a halt. Read our take on what metrics are pointing to for $SOL. 👀 https://t.co/P7AnKYfKYN
— Santiment (@santimentfeed) December 28, 2022
Read Solana’s [SOL] Price Prediction for 2023-24
At press time, SOL traded at $9.44, and its price could fall further if its FUD strengthened.
SOL’s free fall: Will the bulls find stable support?
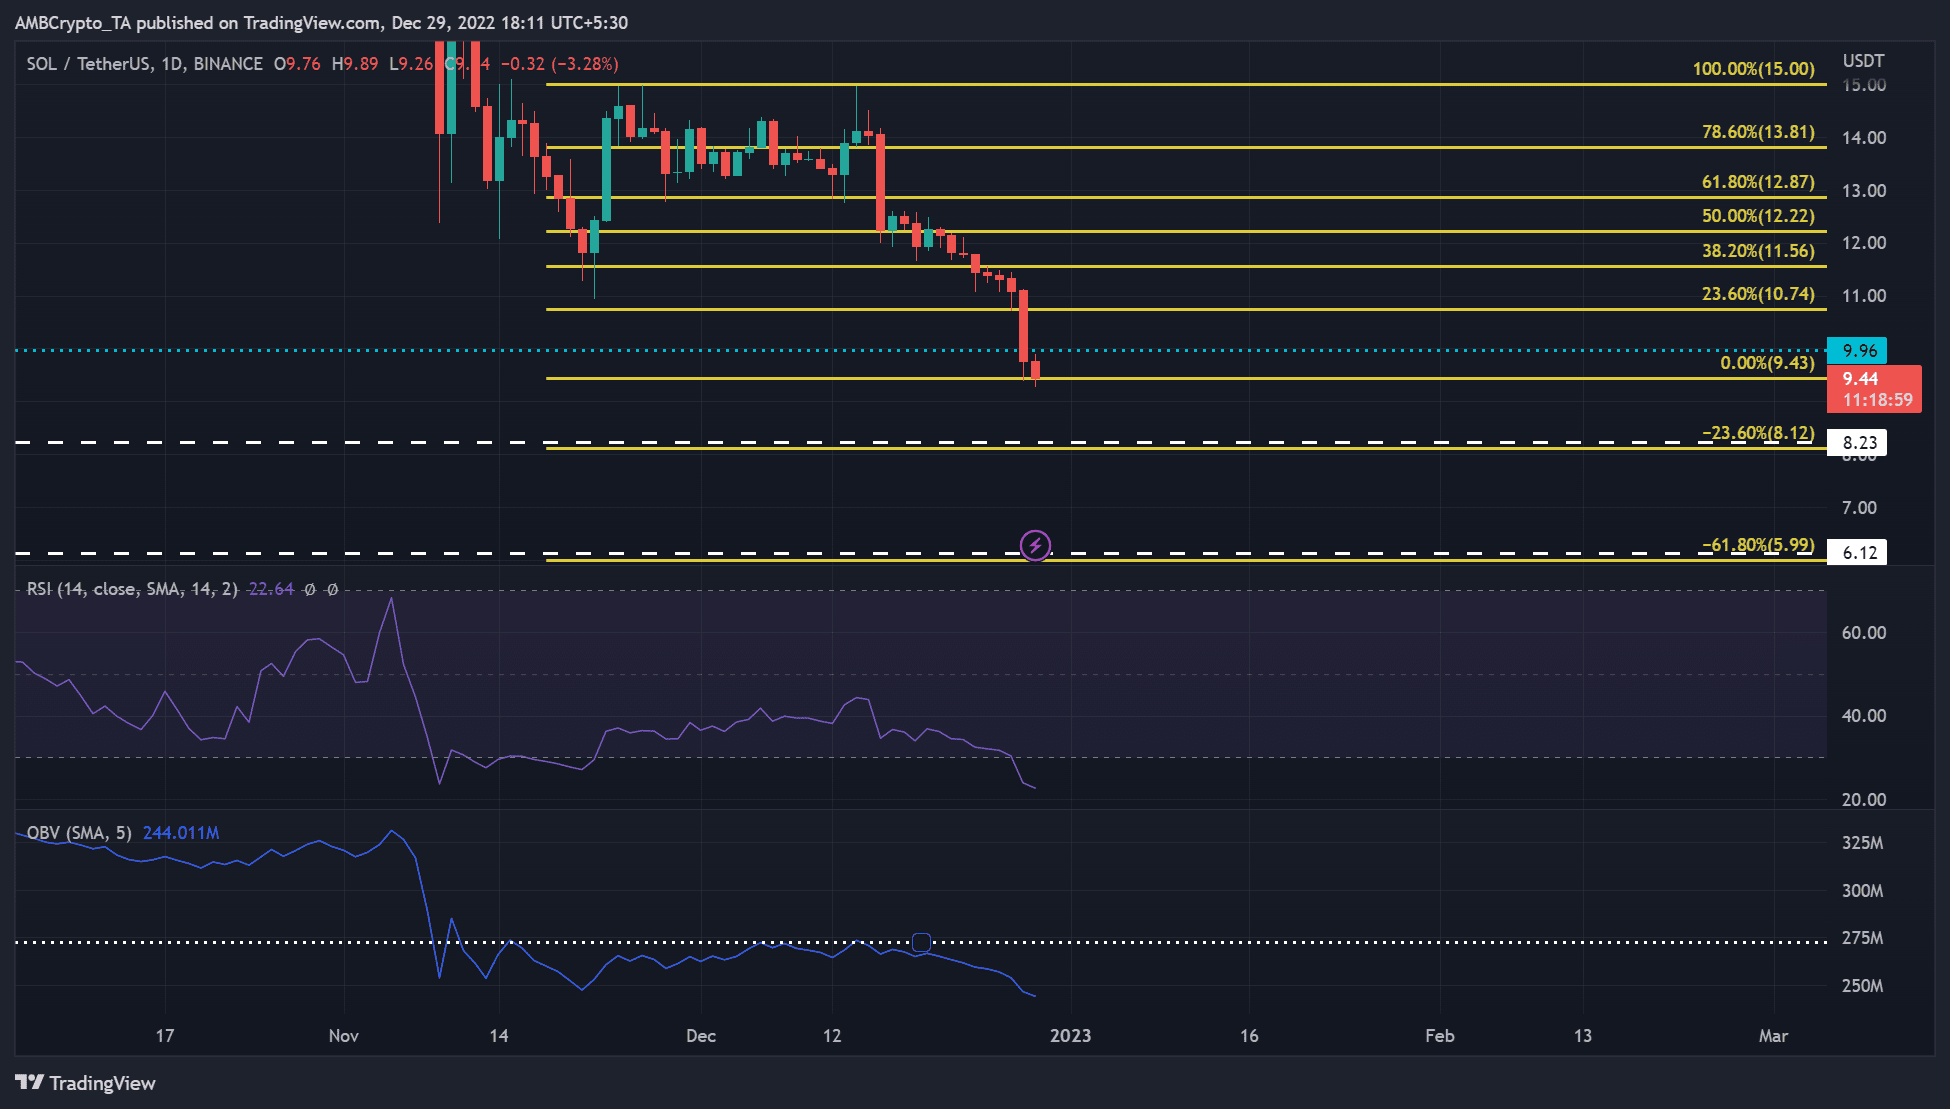
Although SOL’s Relative Strength Index (RSI) on the daily chart was deep in oversold territory, a price reversal wasn’t expected. The plunge of the RSI into the oversold territory indicated that the buying pressure had diminished greatly, which boosted the sellers.
The on-balance volume (OBV) also fell sharply, removing the trading volume needed to reinforce buying pressure. Therefore, selling pressure intensified and pushed SOL down. If selling pressure continued its trajectory at press time, a break below $9.43 was possible.
Bulls may find new support at $8.12, however, if this level failed to hold, another at $5.99 may suffice. Thus, the levels can serve as short-selling targets, with a stop loss above the 23.6% Fib level of $10.74.
A breakout above $10.74 would invalidate the above bias. However, such an upside move will only occur once the bulls break above the $9.66 hurdle.
Solana was riskier and discounted, as Sharpe and volatility ratio were negative
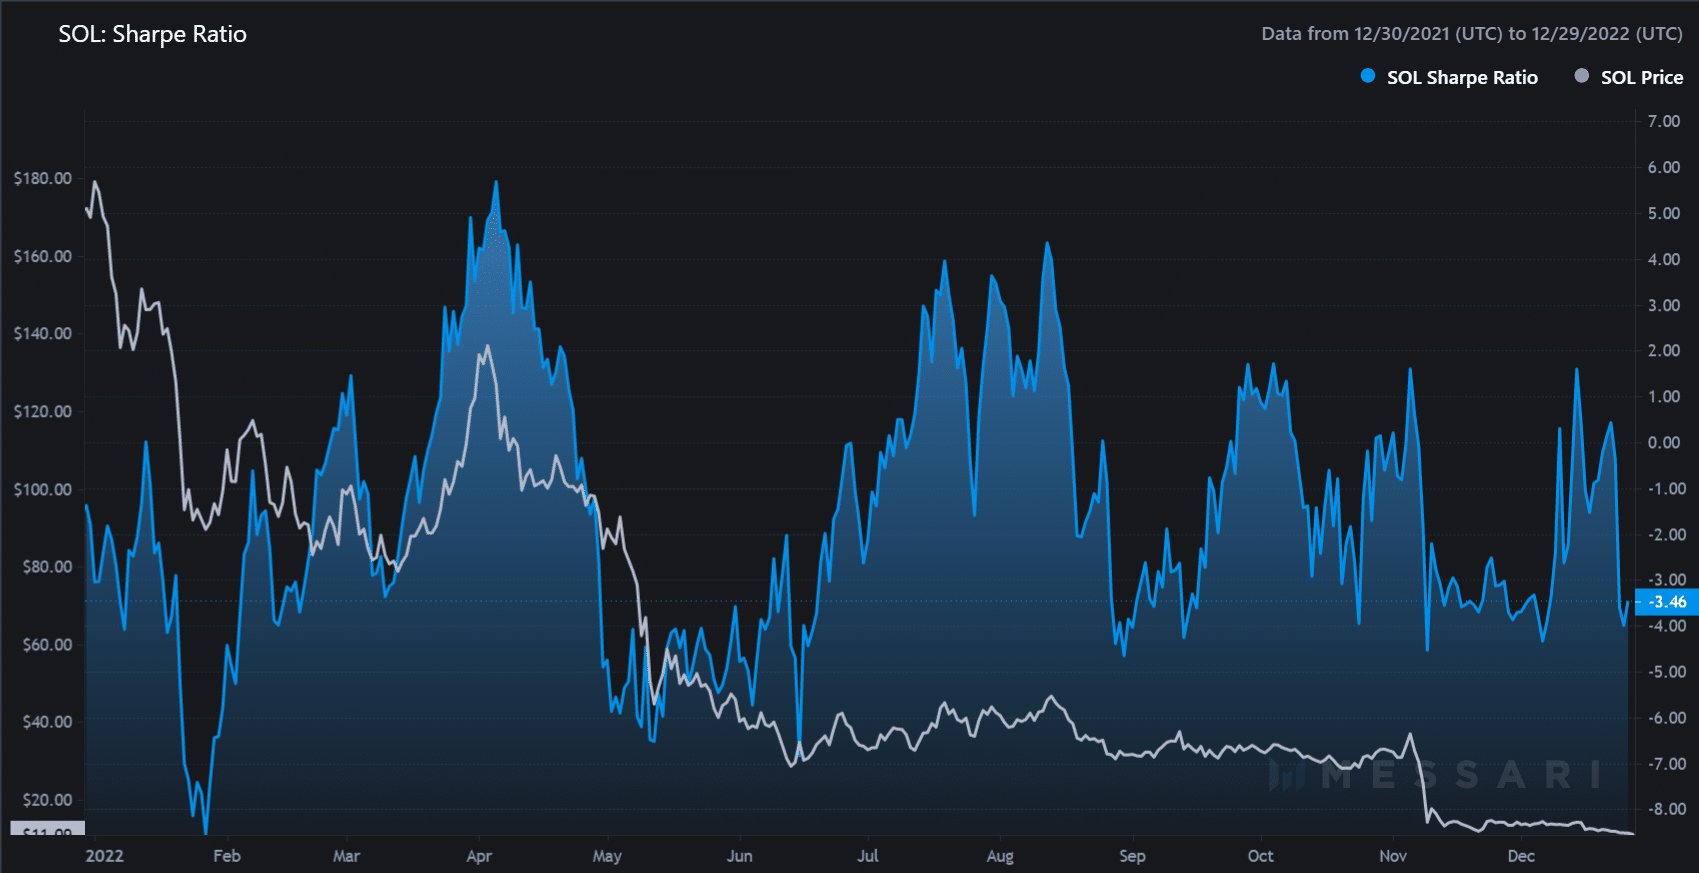
At press time, SOL’s Sharpe Ratio was -3.46%, according to Messari. The Sharpe ratio indicates how profitable or risky an asset is, compared to risk-free assets such as U.S. government bonds. A negative ratio shows that SOL has made more losses compared to risk-free assets.
For comparison, SOL reported a loss of 5.78% at the time of publication. For comparison, Ethereum [ETH] and Bitcoin [BTC] recorded a daily loss of 5.90% and 5.21%, respectively, which made them safer alternatives.
How many SOLs can you get for $1?
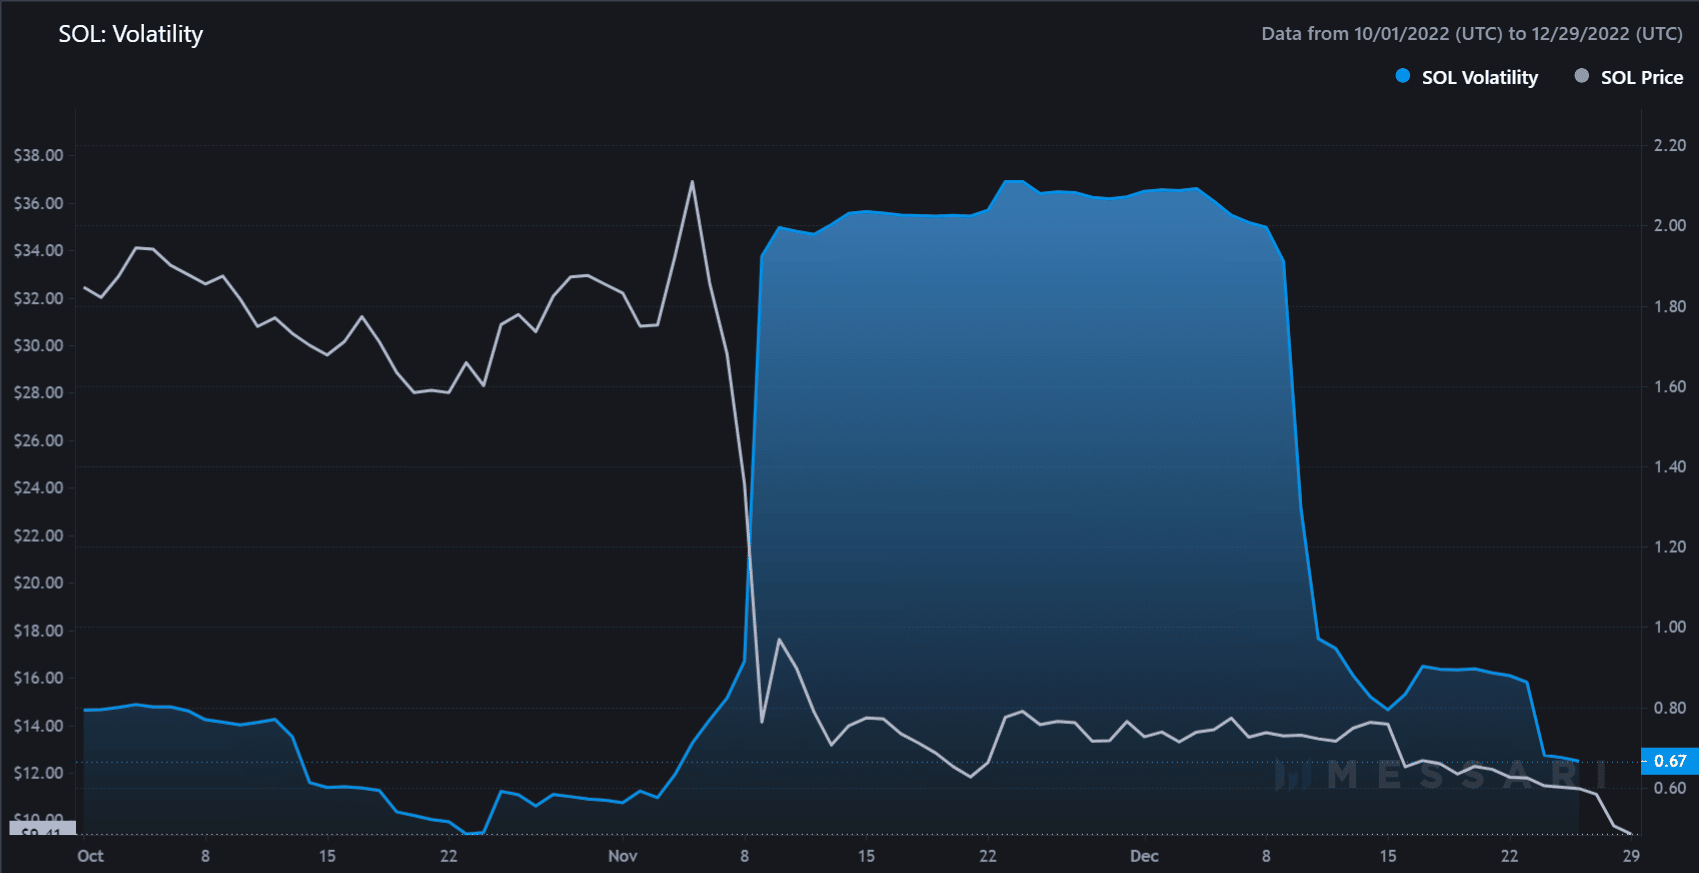
Nevertheless, the volatility ratio of SOL was -0.67, indicating that its current value was a discount to the buyer. Volatility above one indicates that an asset is overvalued, while negative volatility indicates an undervalued asset.
Could the current discounted prices of SOL attract demand for a potential turnaround?