Here are three reasons why Bitcoin is ready for a recovery to $42,000

Bitcoin price suffered a fatal setback after Russia attacked Ukraine. The same effect was seen across financial markets, including Russia’s stock market. Despite this sudden downswing, BTC’s on-chain metrics show signs that indicate a quick turnaround.
On-chain metrics reveal investors’ sentiment
Perhaps, the most important metric is the on-chain volume since it can be used to get a better look at the actions of investors. The on-chain volume for BTC spiked by 13.73 billion on 19 February to 46.38 billion on 24 February.
This uptick occurred as the price of BTC dropped from $40,122 to $34,400 in the same period. The divergence alone is enough to indicate that there was high interest among investors for this dip. And, thus it hints at accumulation.
A similar spike in volume was witnessed on 7 February after BTC crashed from roughly $57,800 to $41,600. This fractal nature of volume uptick indicates that investors were busy buying the dip.
Interestingly, both these bumps moved well above the 200-day Moving Average for the volume. Thereby, indicating long-term holders’ footprint.
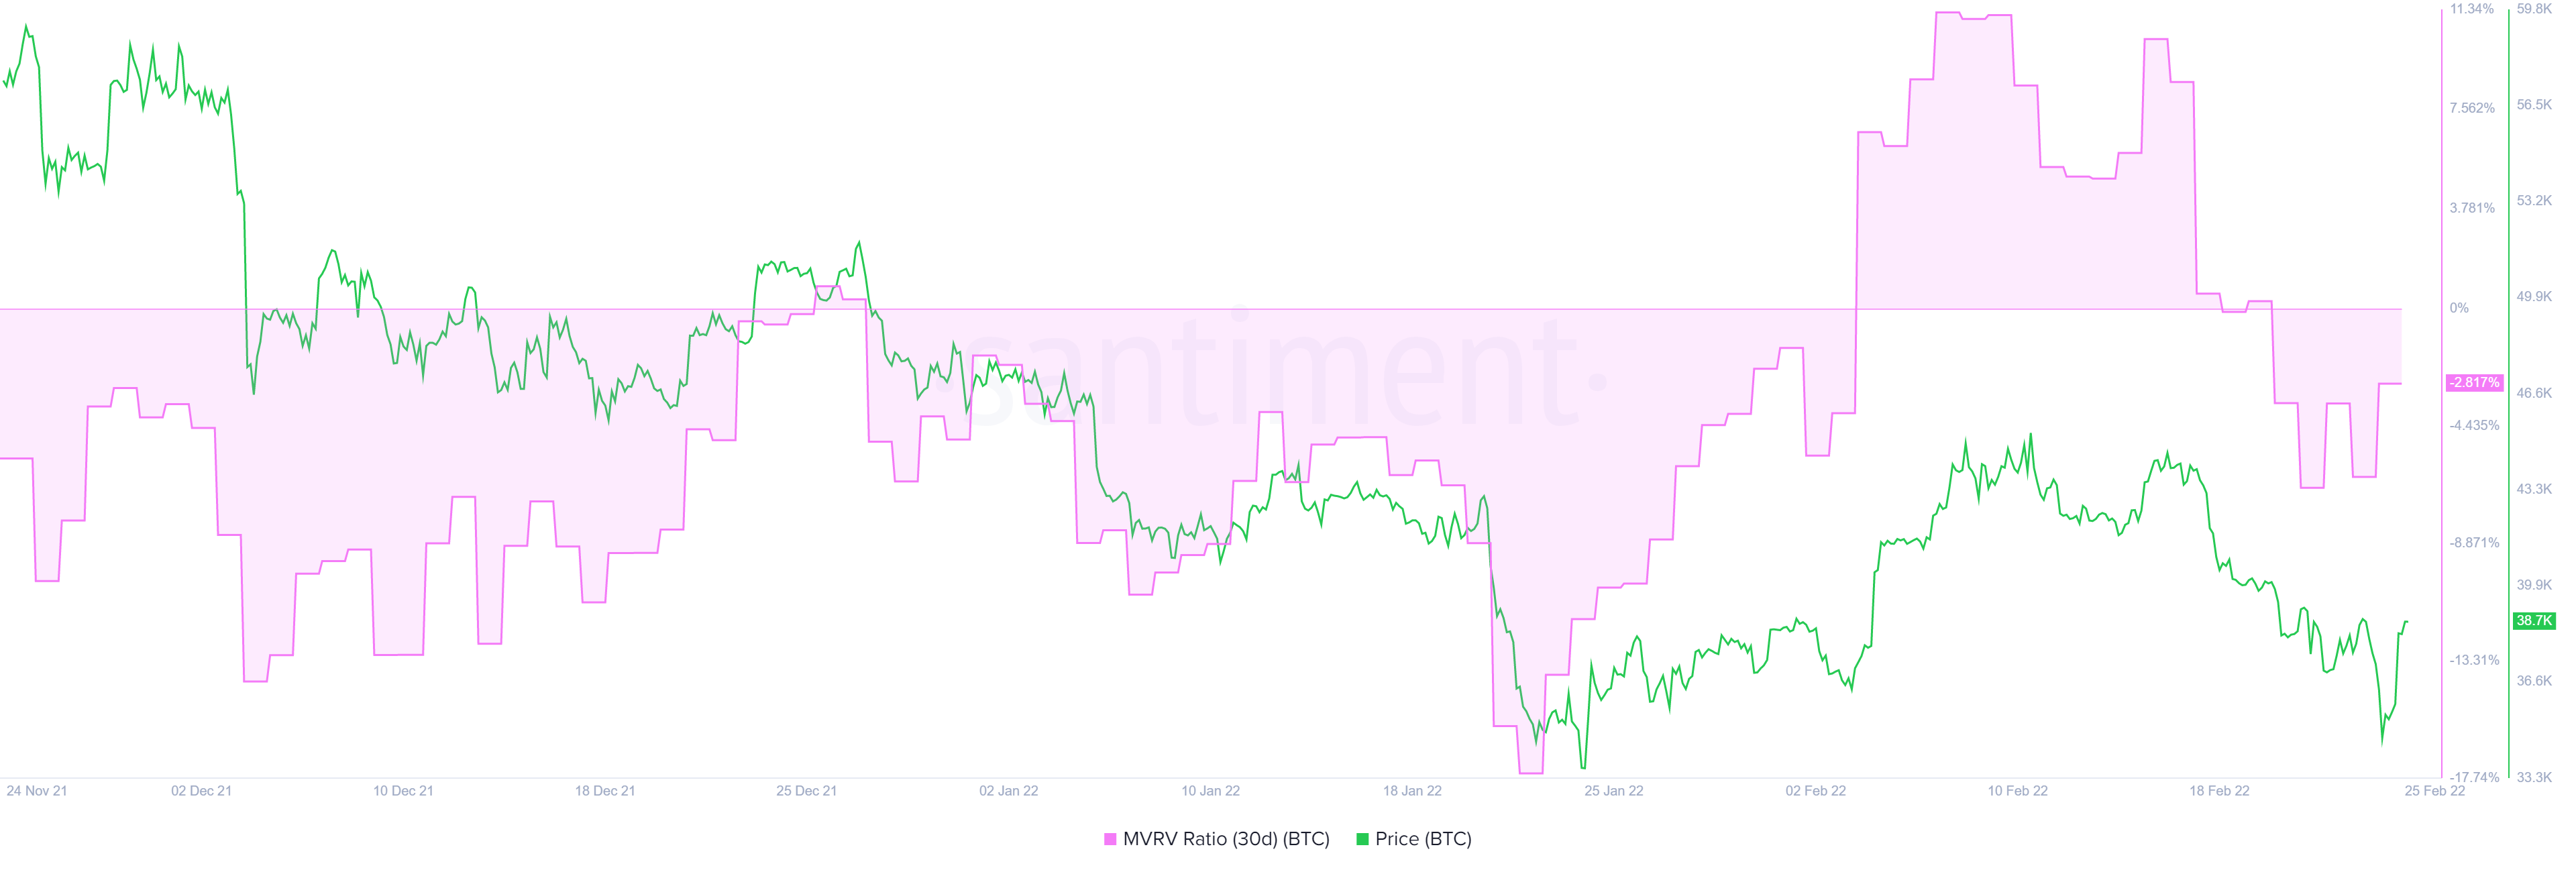
This bullish outlook might seem unreliable at first glance, but the view is supported by the 30-day Market Value to Realized Value (MVRV) model. This indicator is used to measure the average profit and loss of investors over a particular time frame. A negative value below -10% often indicates an ‘opportunity zone’ where long-term holders buy from panic selling short-term traders.
The 30-day MVRV has seen a bump from -6.8% to $2.8% over the last three days, adding proof that long-term holders are indeed accumulating.
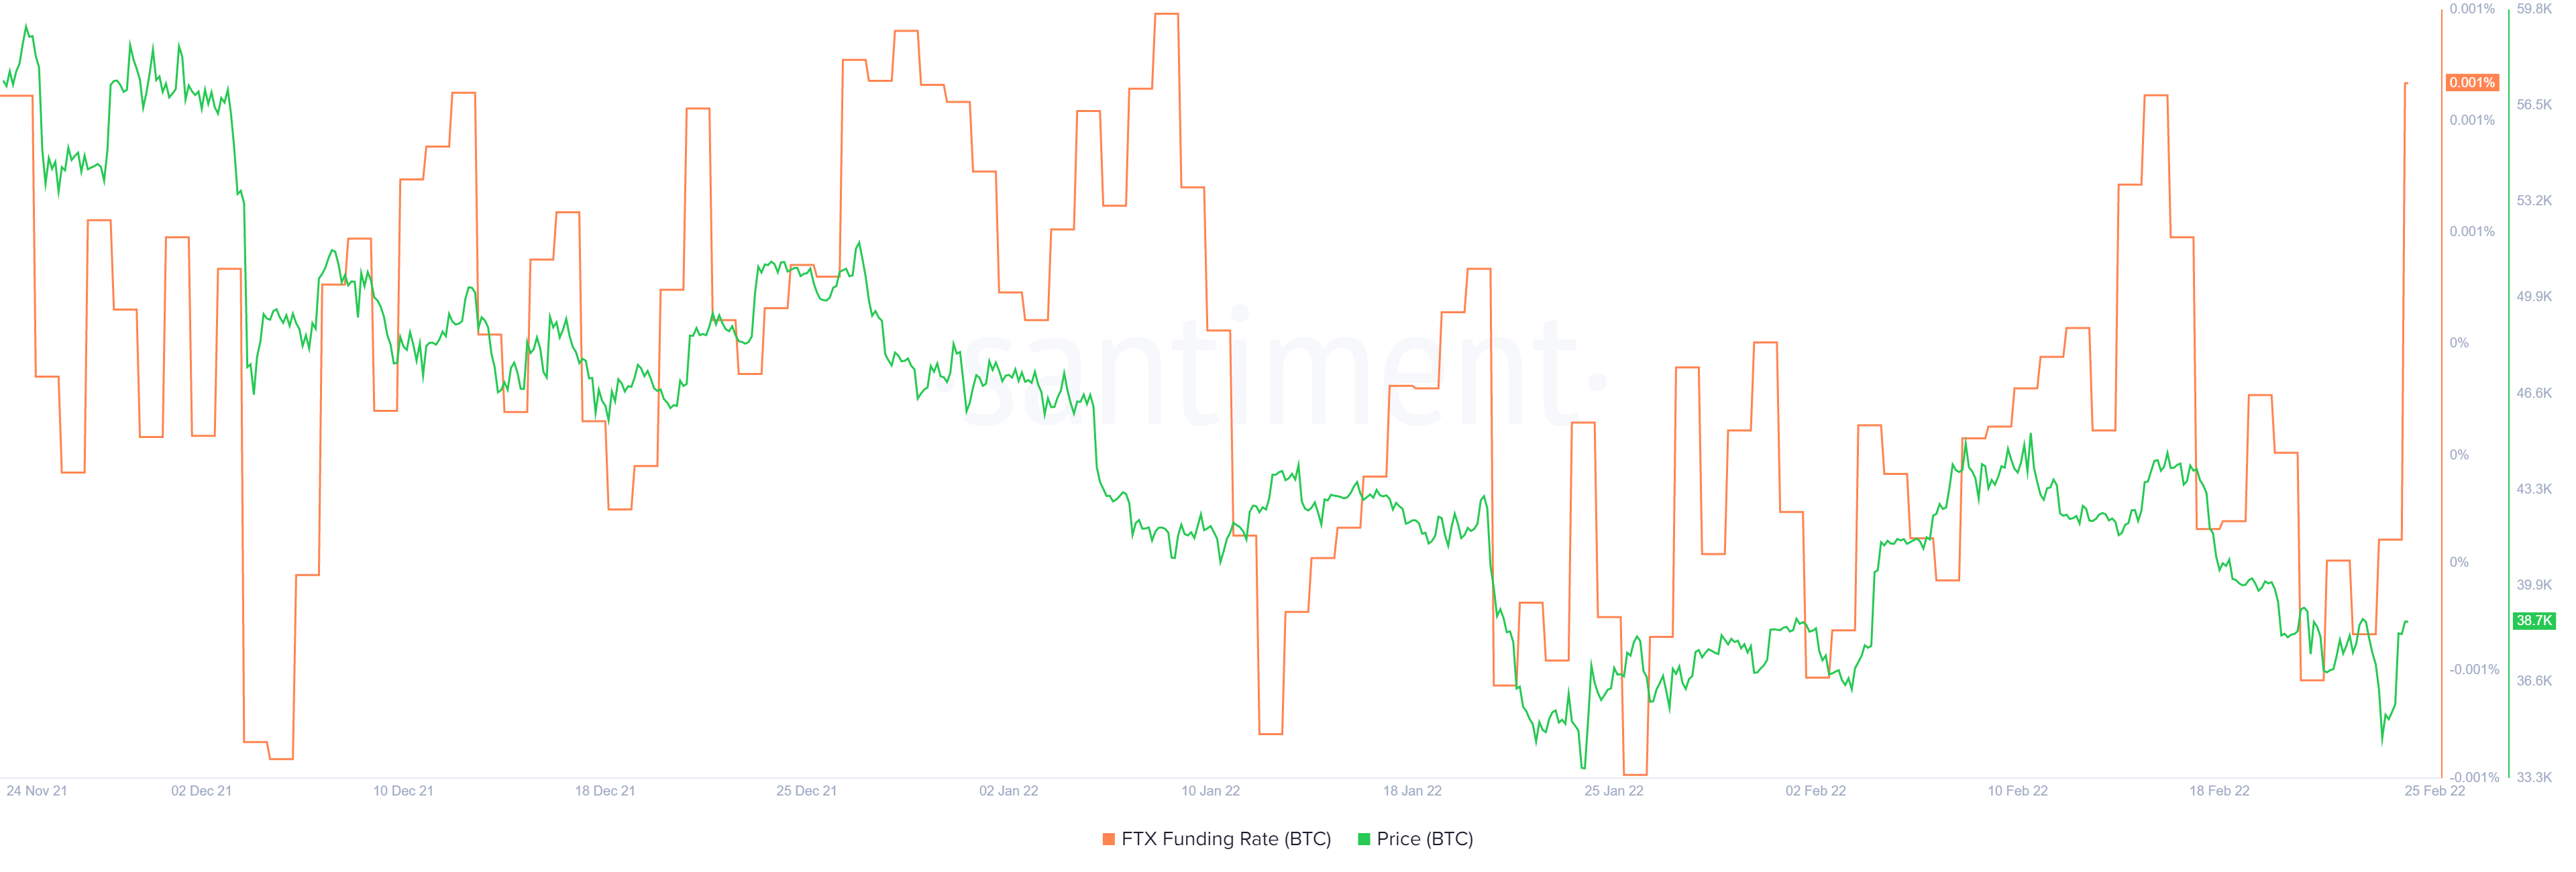
A much clearer picture of the BTC market can be discerned by looking at the funding rate chart. This indicator is used to identify the sentiment of the market. A higher but positive value indicates that most traders are bullish on BTC. And, a negative value often indicates that most of the traders are looking to short.
Lately, the funding rate was on a climb and showed no respite as it hit a new all-time high in early 2022. However, from a short-term perspective, the funding rate nosedived to -0.00071% during the crash, indicating the sentiment of the traders. However, it is currently hovering around 0.001%, revealing the bullish outlook around the king coin.
While things are looking up for BTC’s price in the short-term, the upside seems to be capped at around $43,000. Furthermore, any move beyond this level seems unlikely, especially if the buyers do not have their backs into the incoming uptrend.


