Here’s how long it will be before XRP challenges its current trend

Disclaimer: The findings of the following analysis are the sole opinions of the writer and should not be considered investment advice
XRP reversed back into its oscillation range after hitting its nine-month resistance around the $1.3-mark. Thanks to this fall, the altcoin saw a long-term down-channel (white) on its daily chart. Also, it lost the vital $1-mark and flipped it to resistance.
A compelling close above its trendline support (white, dashed) would set XRP up for a test of the $0.75 to $0.79 range. This range represented a confluence of hurdles like the 20-50 EMA and its supply zone.
At press time, XRP was trading at $0.7359, up by 3.1% in the last 24 hours.
XRP Daily Chart
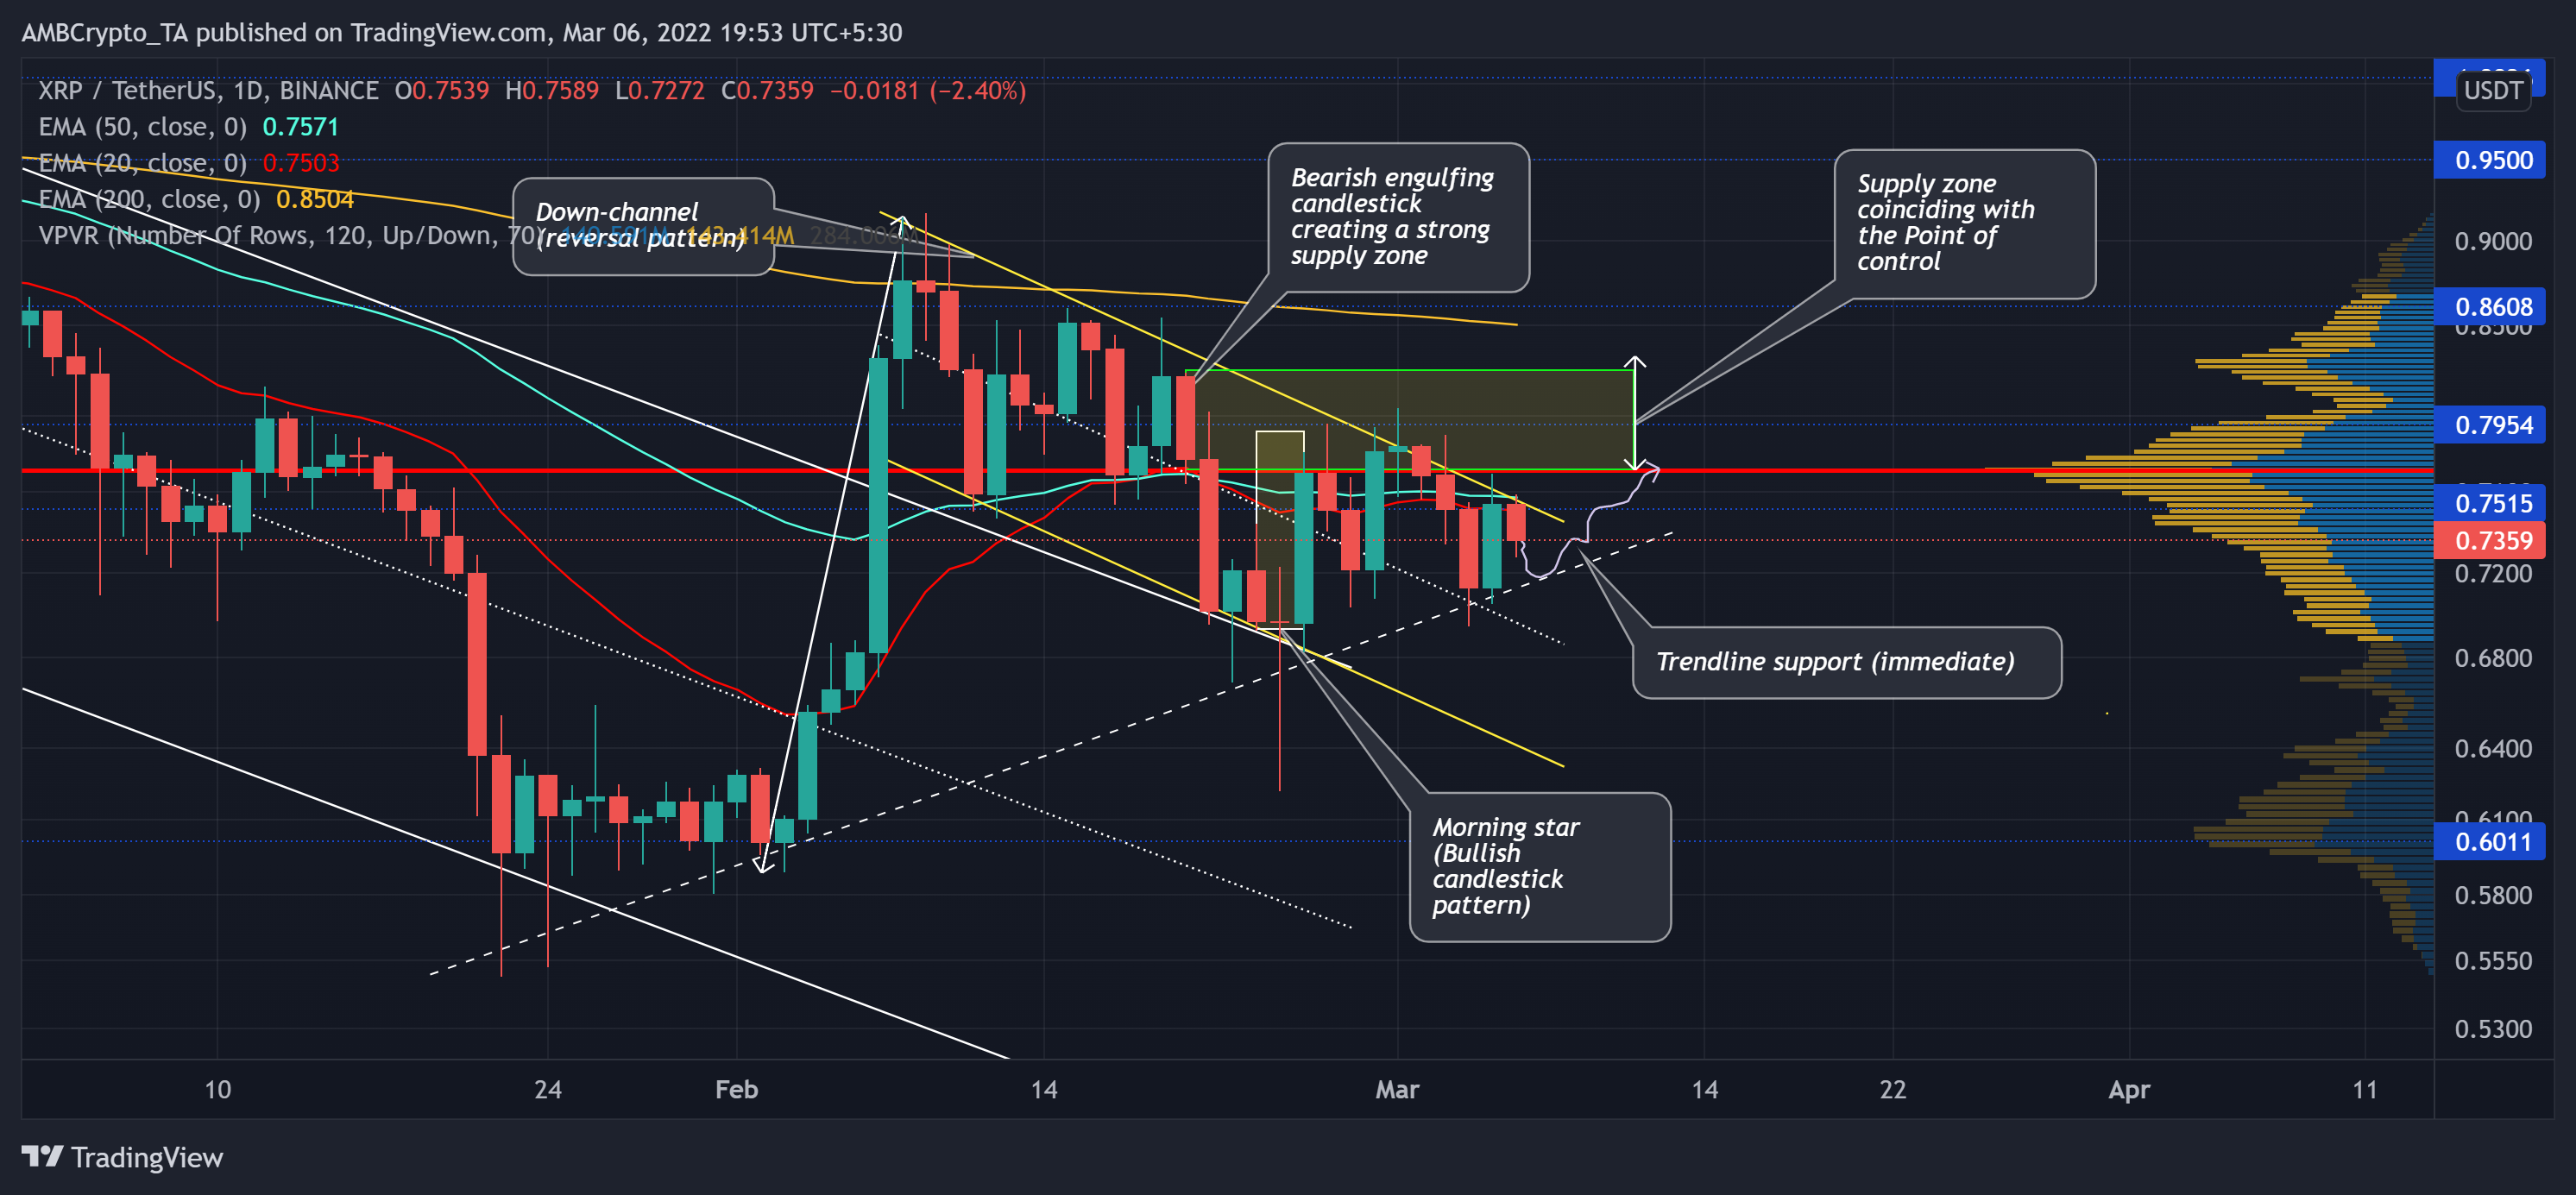
During its latest bearish phase, XRP fell below its near-term EMAs while losing some crucial levels. But the $0.6-support stood sturdy over the last 11 months. In doing so, it registered a 55.08% ROI from 3 to 8 February as it broke out of the channel.
Since then, the altcoin has entered into a steep pullback in a descending channel (yellow). This trajectory led to the first retest of the upper trendline channel (white). Following the same, XRP pictured the morning star candlestick pattern, one that triggered a gradual uptrend over the last few days.
Also, its immediate supply zone stood as a strong barrier for the EMA lines to undertake a bullish crossover.
From here on, any pullbacks would find testing ground near the $0.7-zone, one that coincides with the trendline support (white, dashed). A revival from this zone could propel a retest of its Point of Control (red) before the alt commits itself to a position.
Rationale
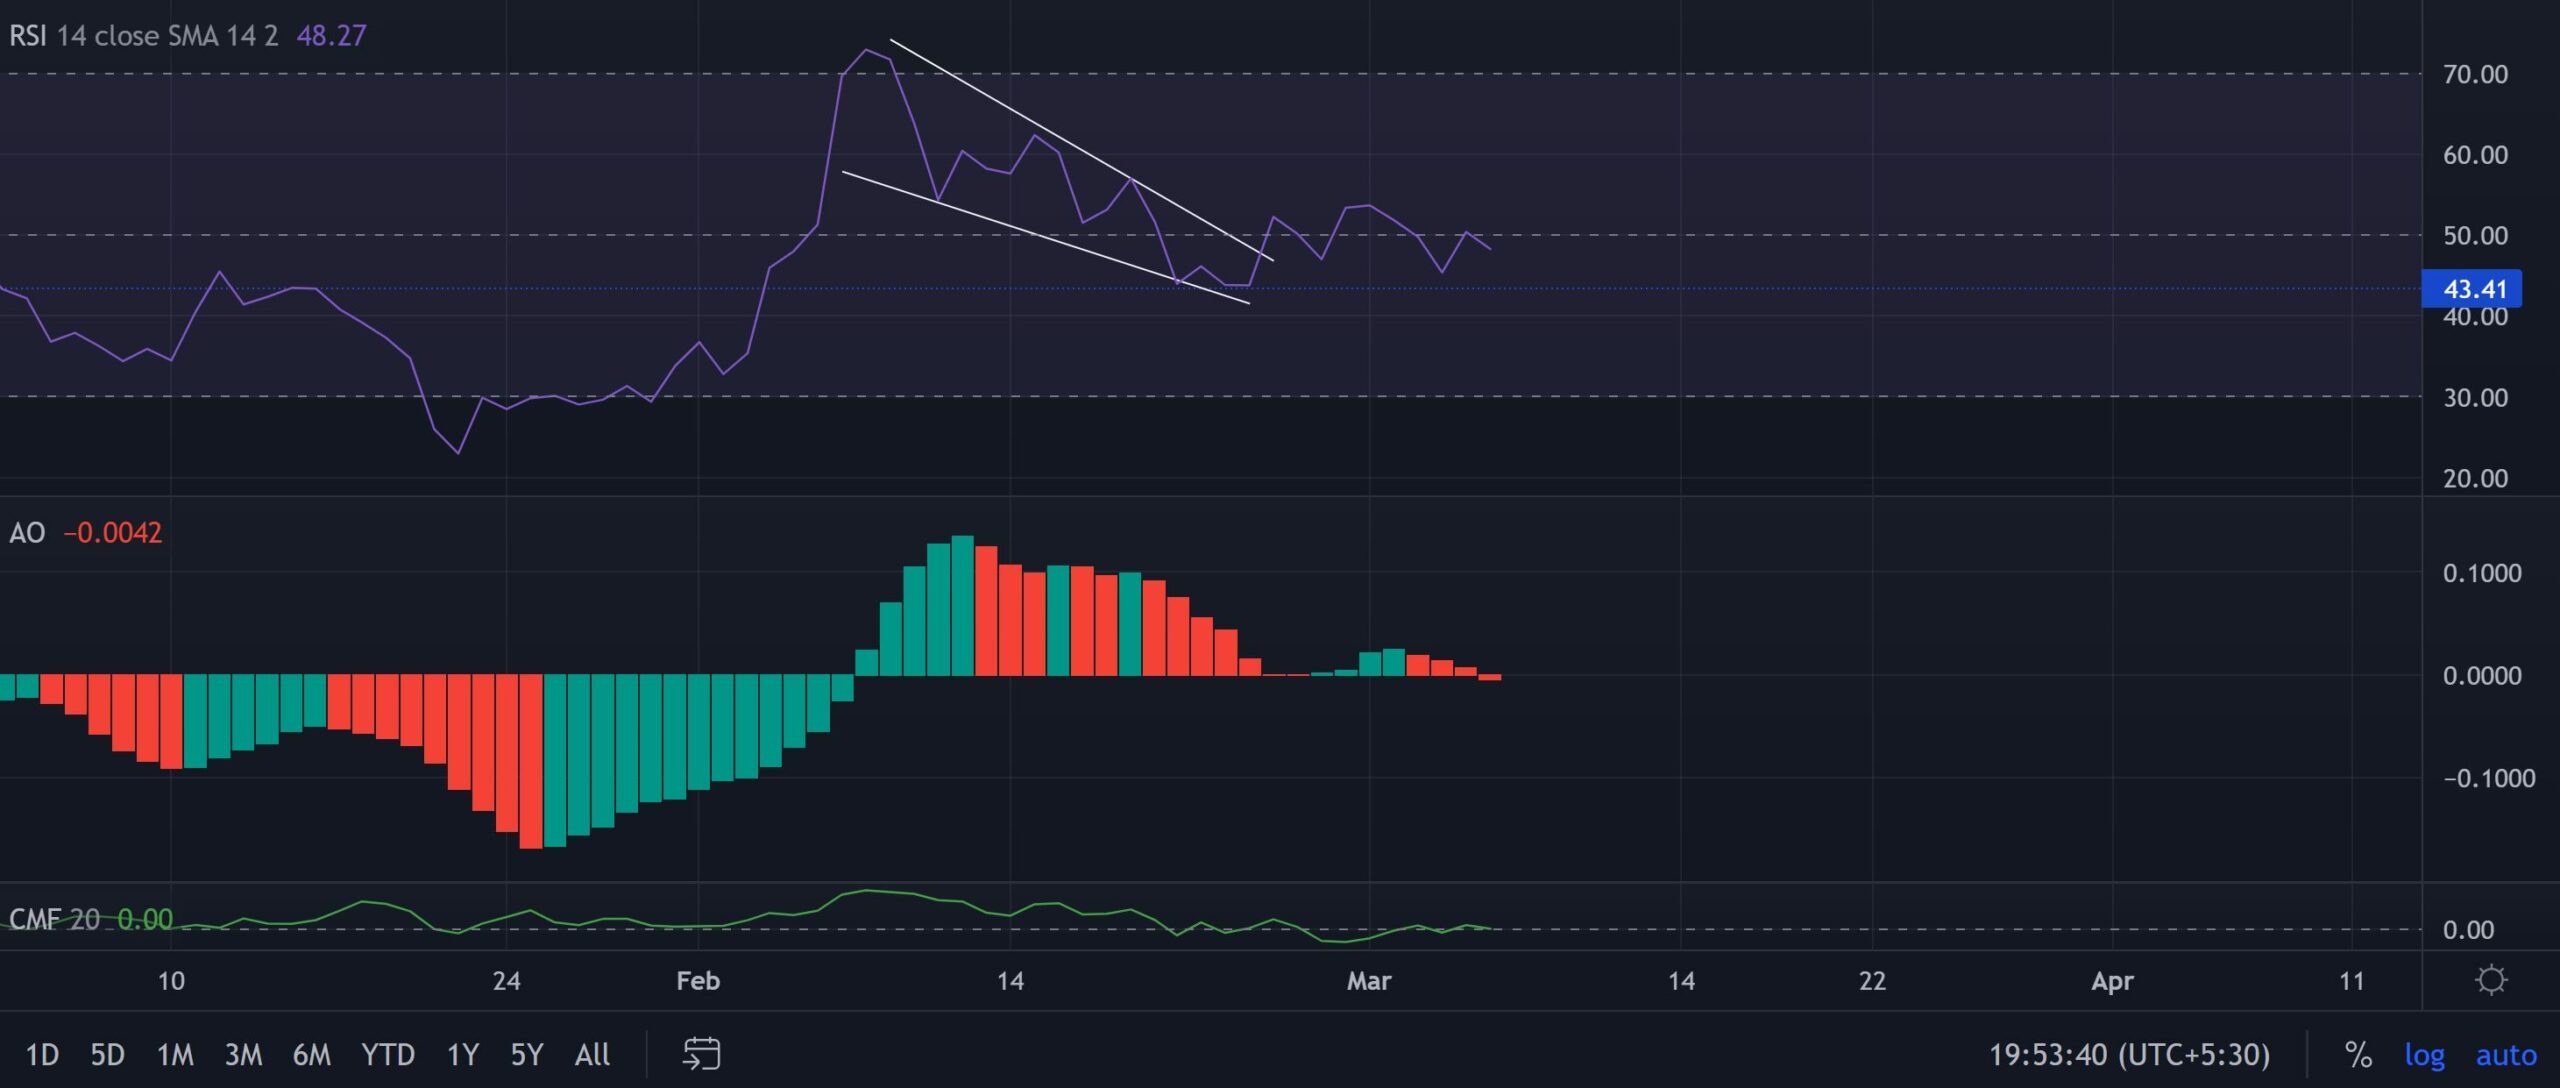
The RSI has strived to overturn the equilibrium since 25 February but failed to find a close above this level. This revealed a bearish edge. Any pullbacks from here would find a floor near the 43-point mark.
Furthermore, the Awesome Oscillator marked lower peaks on its histogram. Also, the histogram plunged below the midline over the last few hours, reaffirming the bearish vigor.
Conclusion
A further dip towards its immediate support could be likely before the bulls gain momentum to challenge its near-term downtrend. Furthermore, keeping in mind XRP’s proximity to its near-term EMAs, the chance of a volatile move in the days to come is high.
Even so, keeping an eye on Bitcoin’s movement and the broader sentiment would be important to complement the aforementioned analysis.


![UPbit lists Derive [DRV] across KRW, BTC, and USDT markets - Will demand follow?](https://ambcrypto.com/wp-content/uploads/2026/07/Lazaro-2026-07-14T110021.781.jpg)