Here’s how MATIC traders can make the most out of this major breakdown

Disclaimer: The findings of the following analysis are the sole opinions of the writer and should not be considered investment advice.
Polygon MATIC’s recent bearish break below the $0.55-mark opened up shorting opportunities for traders. While the altcoin enters into a high volatility phase, the current structure exhibited strong selling tendencies.
The current pull below the four-month trendline resistance (yellow, dashed) brought MATIC back into its long-term bearish track.
At press time, MATIC traded at $0.425, down by 16.57% in the last 24 hours.
MATIC Daily Chart
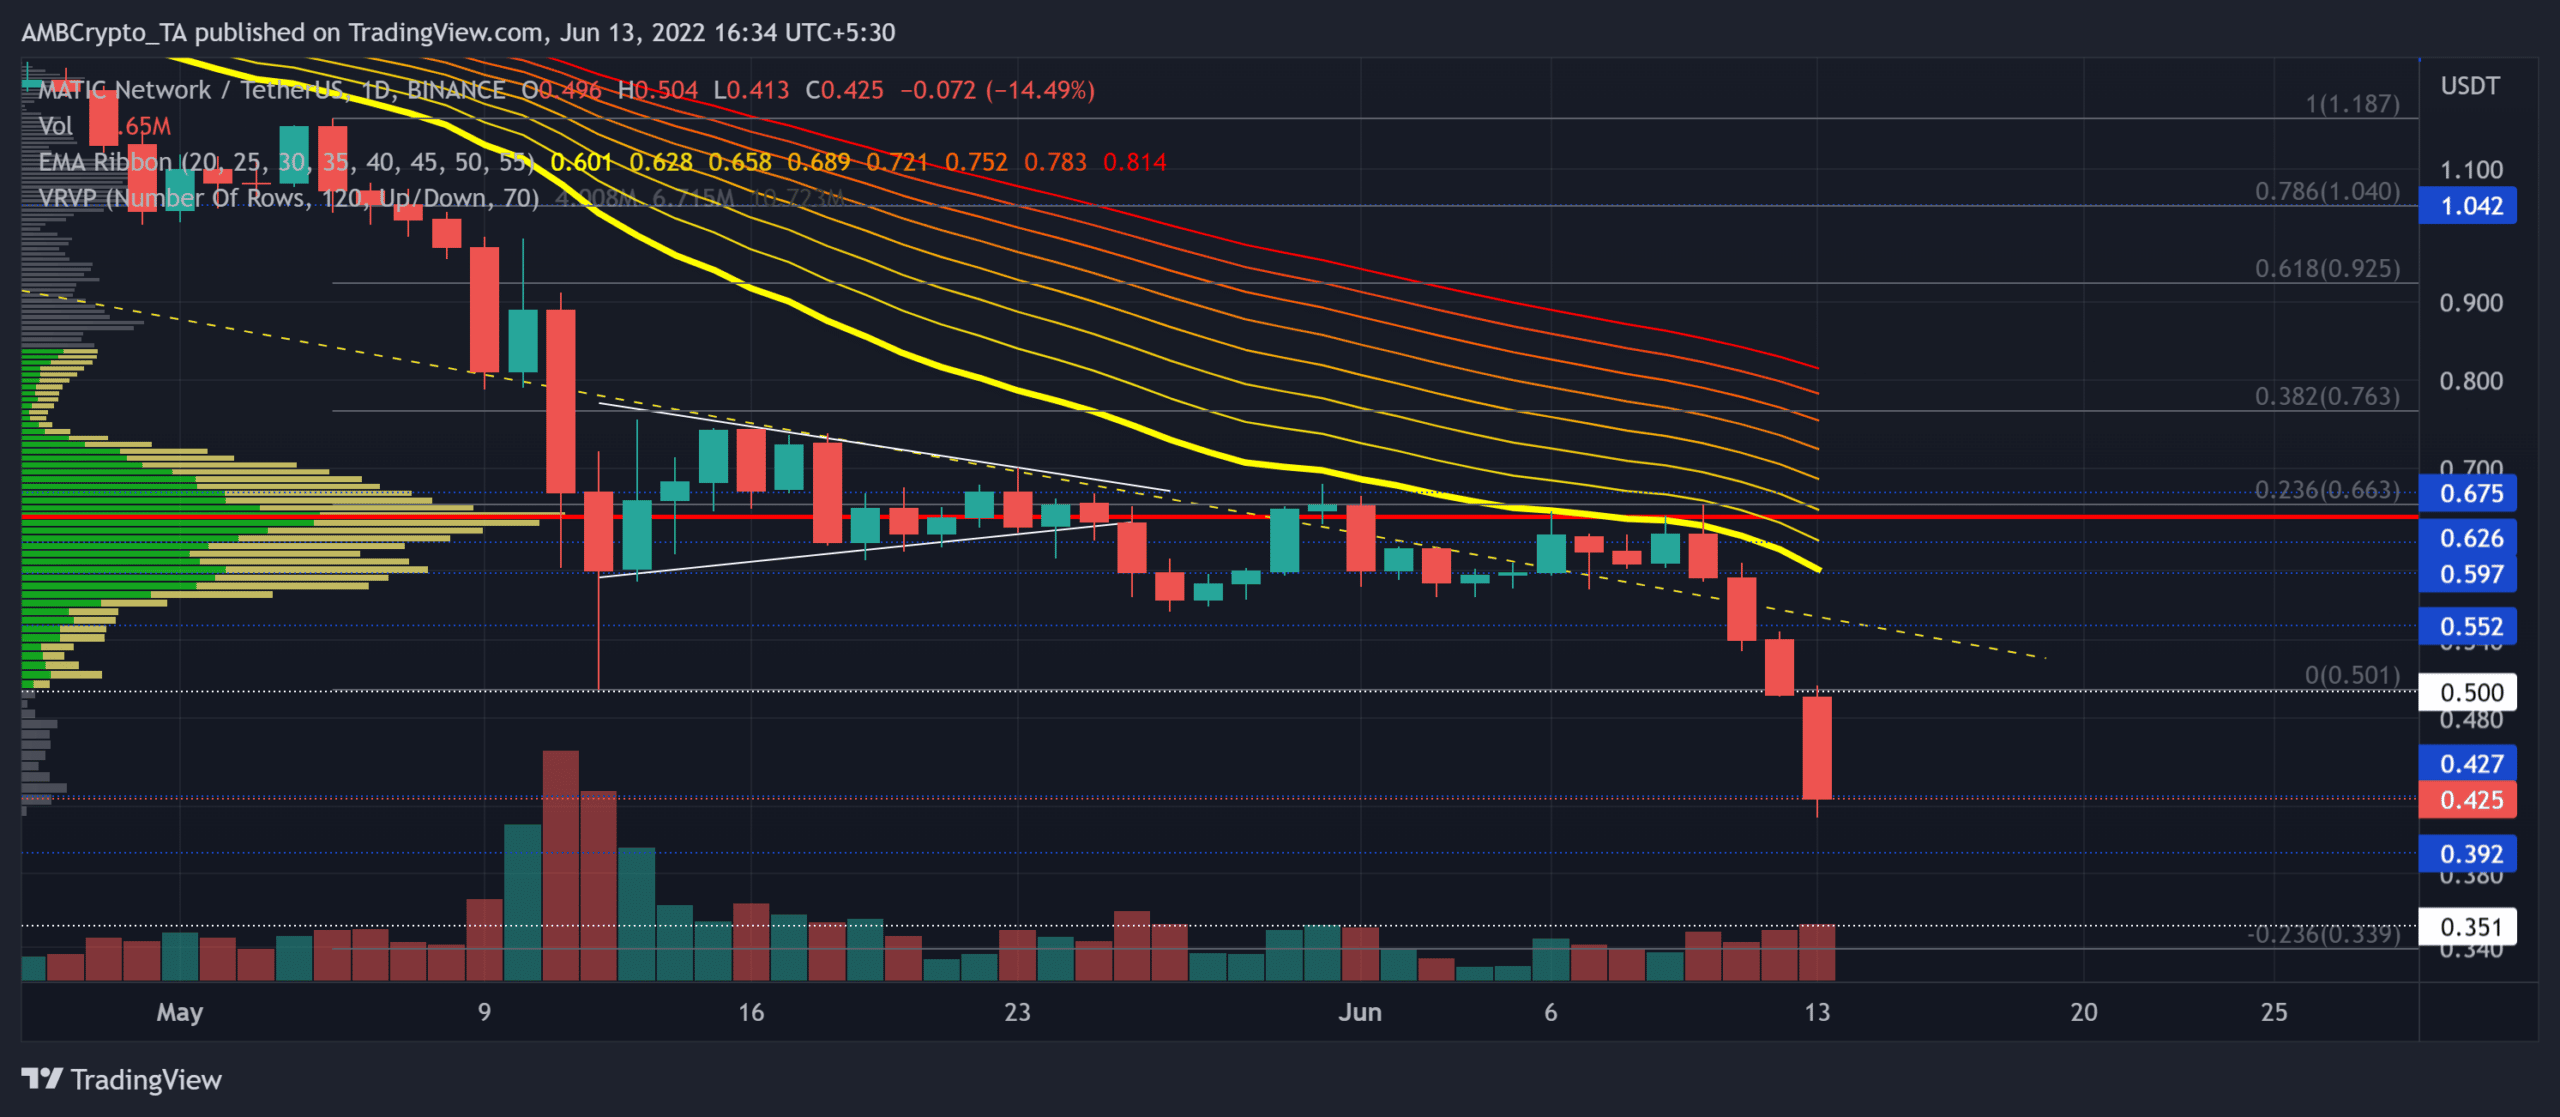
The 23.6% Fibonacci resistance curbed the bullish rallies for nearly a month. The recent reversal from this level opened doorways for a fall toward the 0.4-zone whilst the bulls dwindled.
After hovering at the Point of Control (POC, red) level for weeks, MATIC witnessed a down breakout from its squeeze phase. Due to its relatively higher correlation to Bitcoin, MATIC has struggled to propel a trend-altering rally over the last few months.
Should the current candlestick close below the $0.42-mark, the alt would lose its 13-month support only to confirm a further downside. In this case, potential shorting targets will rest in the $0.35-$0.39 range. The increasing trading volumes during the pulldown have further spiked the probability of an extended downfall.
To invalidate the default bearish tendencies, the bulls would need to steer the EMA ribbons toward the north before any conceivable chances of a robust revival.
Rationale

The Relative Strength Index (RSI)’s rising wedge breakdown headed right into the oversold region on 13 June. A sustained close below the 30-31 range would heighten the chances of profitable bets for the short-sellers.
The MACD lines can be considered commensurate with a selling viewpoint after their recent bearish crossover. A convincing southbound movement from this forth would reaffirm the selling strength in the coming days.
Conclusion
MATIC’s sustained close below the $0.427-level could pave a path toward the lows of the $0.35-$39 range in coming sessions. Post this, the broader market sentiment would play a vital role in influencing the future trajectory.
On the flip side, any bearish invalidations would likely be short-lived by the four-month trendline resistance.
Moreover, investors/traders must keep a close eye on Bitcoin’s movement as MATIC shares a 68% 30-day correlation with the king coin.