Here’s what Stellar [XLM] buyers should know before opening a long position

Disclaimer: The findings of the following analysis are the sole opinions of the writer and should not be considered investment advice.
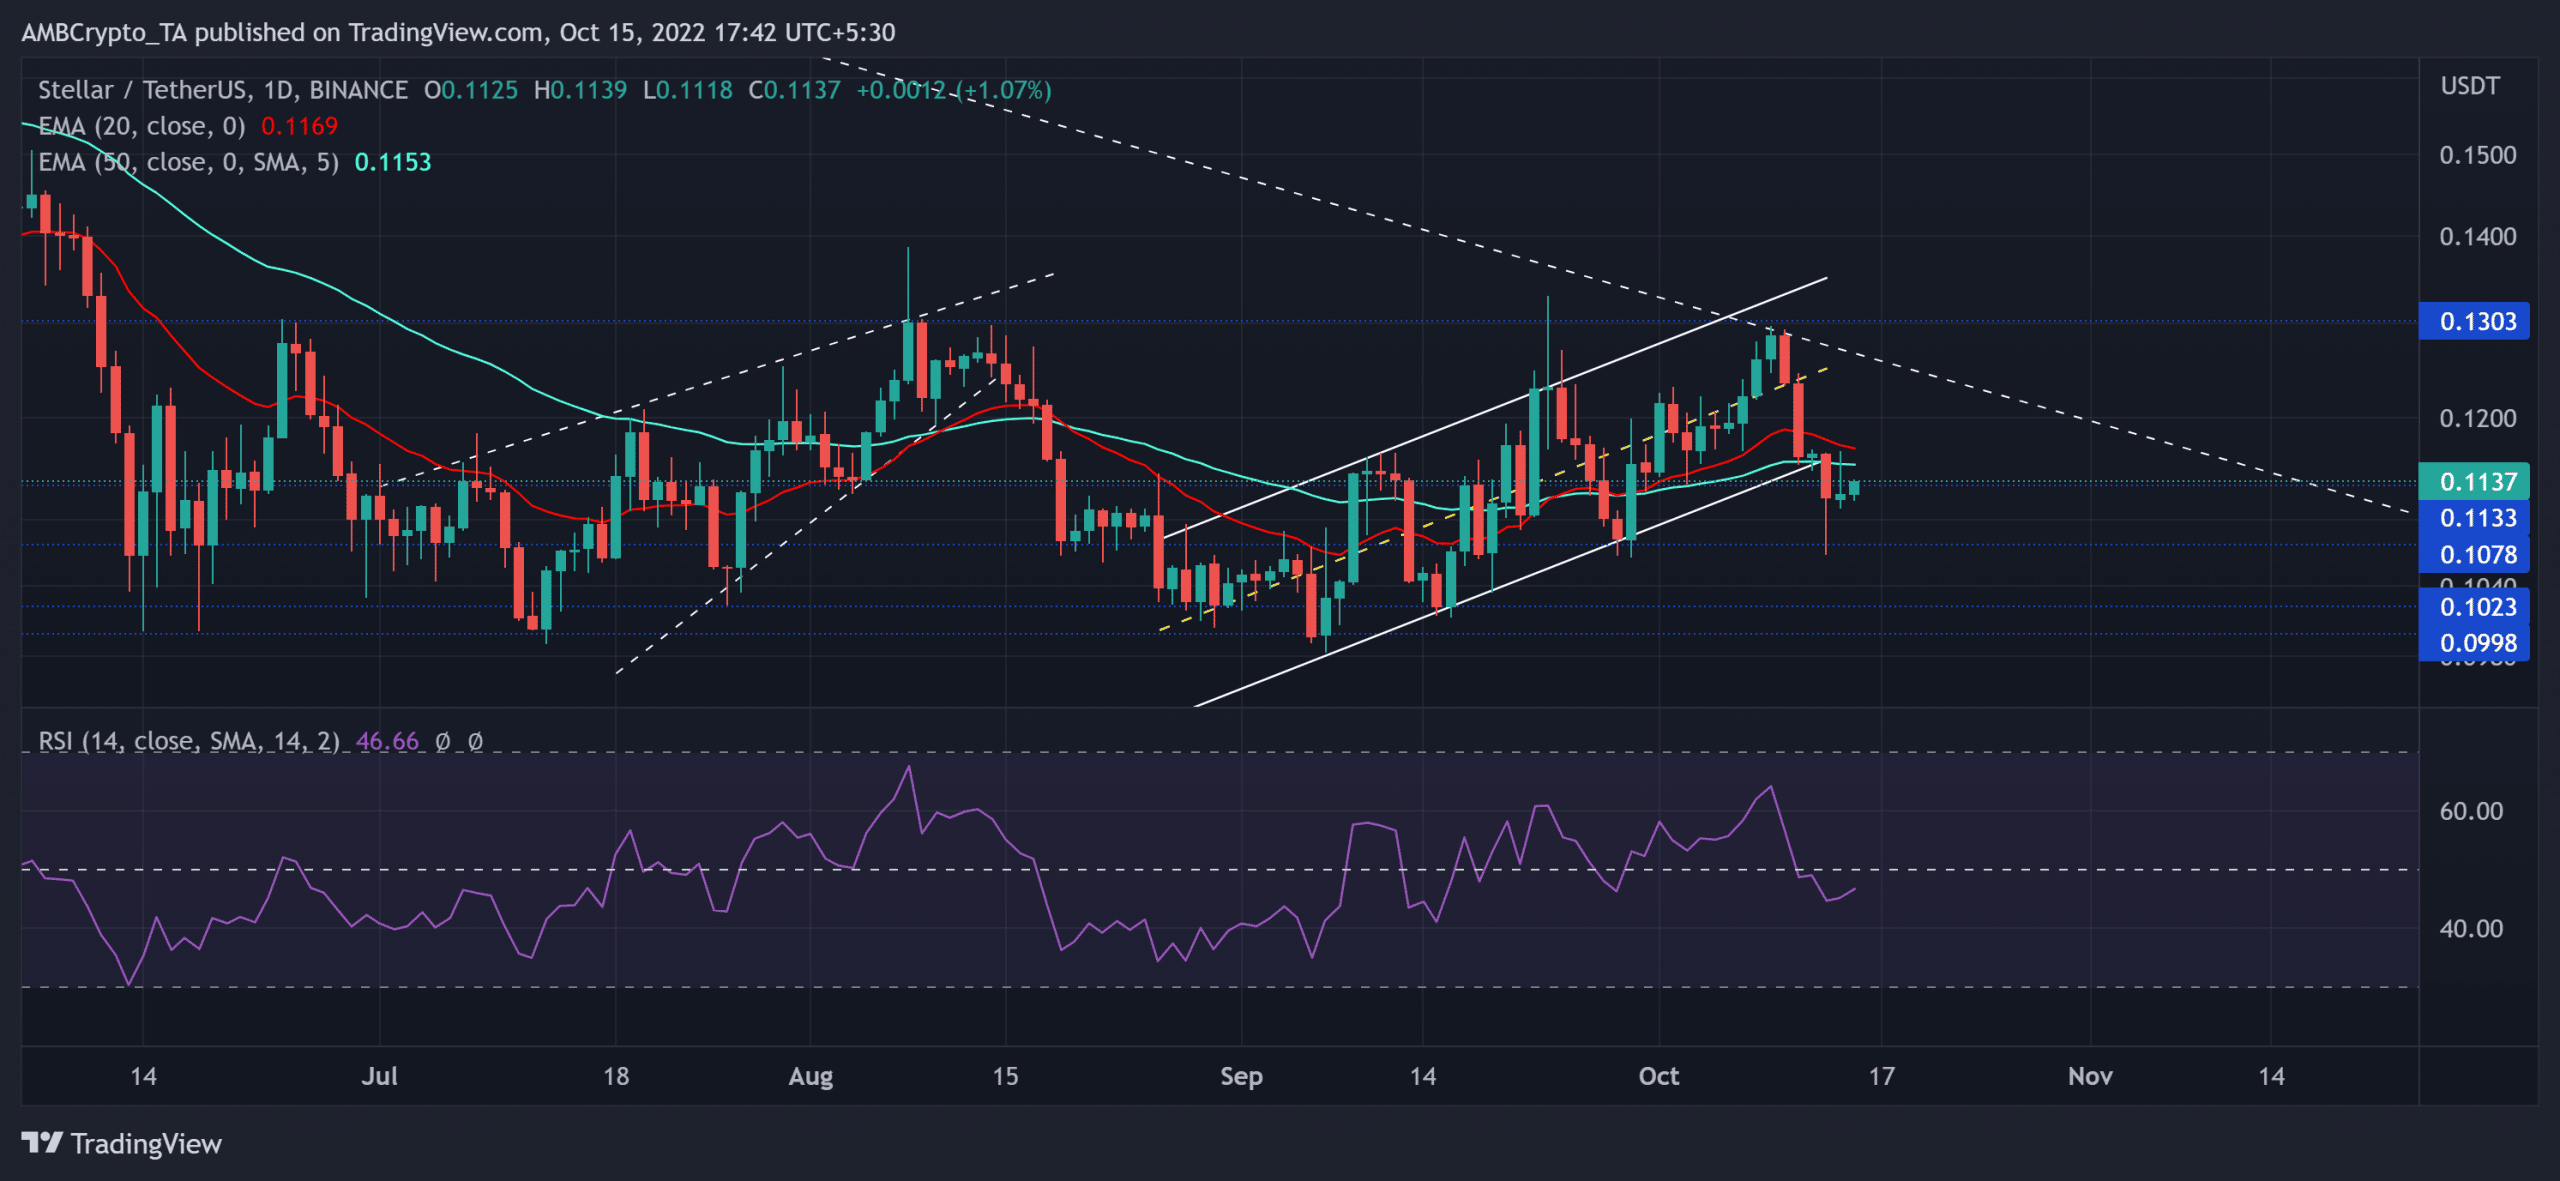
- XLM reversed from its long-term trendline resistance to induce a patterned break.
- The altcoin saw a decline in active users over the last few months.
- The long/short ratio revealed a slight bearish edge.
Over the past month, an expected bullish rebuttal from the $0.09 baseline has induced a bullish volatile break, one that aided Stellar [XLM] in testing the multi-monthly trendline resistance (white, dashed). This buying resurgence entailed an ascending channel structure in the daily timeframe.
Here’s AMBCrypto’s price prediction for Stellar [XLM] for 2023-24
The resultant patterned break has positioned XLM for a potential dull phase in the coming sessions. At the time of writing, XLM was trading at $0.1137.
XLM broke down from its pattern, when will the buyers re-enter?
XLM’s reversal from its multi-yearly highs in May 2021 resulted in a gradual bearish rally for over a year now. Meanwhile, this downtrend chalked out a 17-month trendline resistance.
The consistent write-down of the market cap ultimately pulled the price action toward its 22-month support zone in the $0.09-$0.1 range. Over the last few months, the buyer’s share exhibited inclinations to bounce back from this range.
But the long-term trendline resistance reignited the selling pressure to inflict a bearish engulfing candlestick on 10 October.
Should the price action find its way above the constraints of the 20/50 EMA, the buyers could rekindle recovery hopes. The buyers should look for plausible morning star candlesticks should the current candlestick close as green. In this case, the trendline resistance would continue to pose recovery hurdles.
A likely close below the EMAs and the $0.113 level could inflict a near-term slowdown. In this case, XLM would eye to test its first major support in the $0.107 zone. A decline below this zone would encourage the sellers to retest the long-term support range.
The Relative Strength Index (RSI) headed into the bearish zone to depict a slight selling edge. But its higher troughs over the last few days kept the possibility of bullish divergence alive.
Declined user interest

XLM’s daily active addresses alongside its price have marked a consistent decline over the last year. This reading entailed decreased user traction. Nonetheless, the last month saw a slight uptick in user activity but was yet to witness substantial improvements.
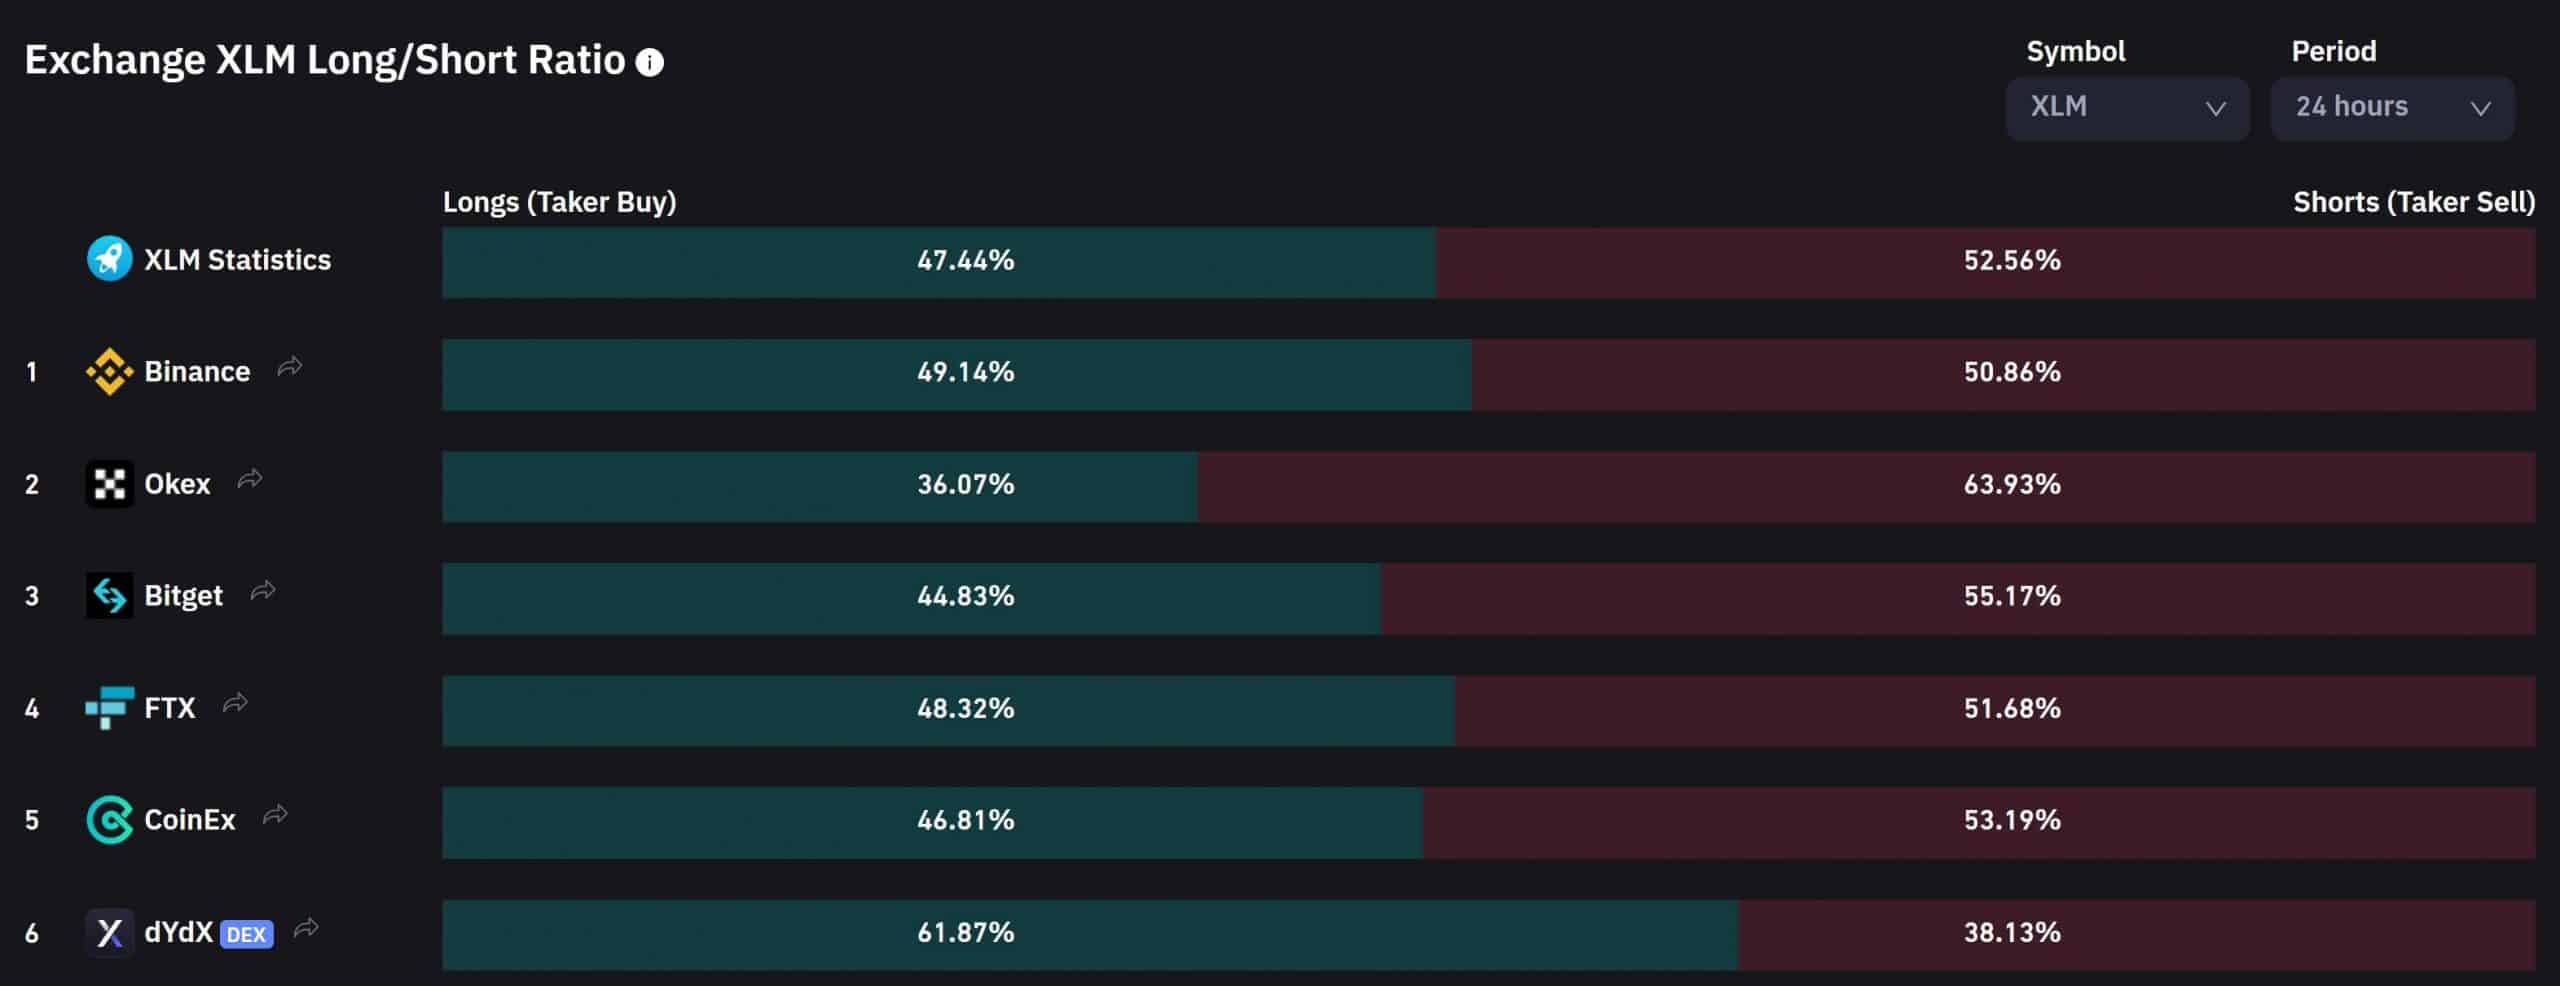
To top it up, the long/short ratio across all the exchanges over the last 24 hours unveiled a slight bearish inclination for the crypto.
Finally, considering the breach of the up-channel structure from the long-term ceiling, sellers would look to maintain their edge. A close above the EMAs could invalidate the selling inclinations. The targets would remain the same as discussed.
Also, investors/traders should factor in broader market sentiment and other on-chain developments to make a profitable move.