How ApeCoin [APE] traders can make profit out of this divergence
![How ApeCoin [APE] traders can make the most out of this divergence](https://ambcrypto.com/wp-content/uploads/2022/07/Untitled-design-49.png)
Disclaimer: The findings of the following analysis are the sole opinions of the writer and should not be considered investment advice.
The extended pulldown from ApeCoin’s [APE] all-time high (ATH) finally saw a buying rebuttal from its all-time low level in the $3.1 zone. The recent gains have aided the alt in finding a position above the 200 EMA (green) after over two months.
While the current price observes a strong rejection in the $6.6 region, APE could see a near-term setback before picking itself up. The traders/investors must look for a break below the pattern in the coming sessions. At press time, APE traded at $6.6177.
APE 4-hour Chart
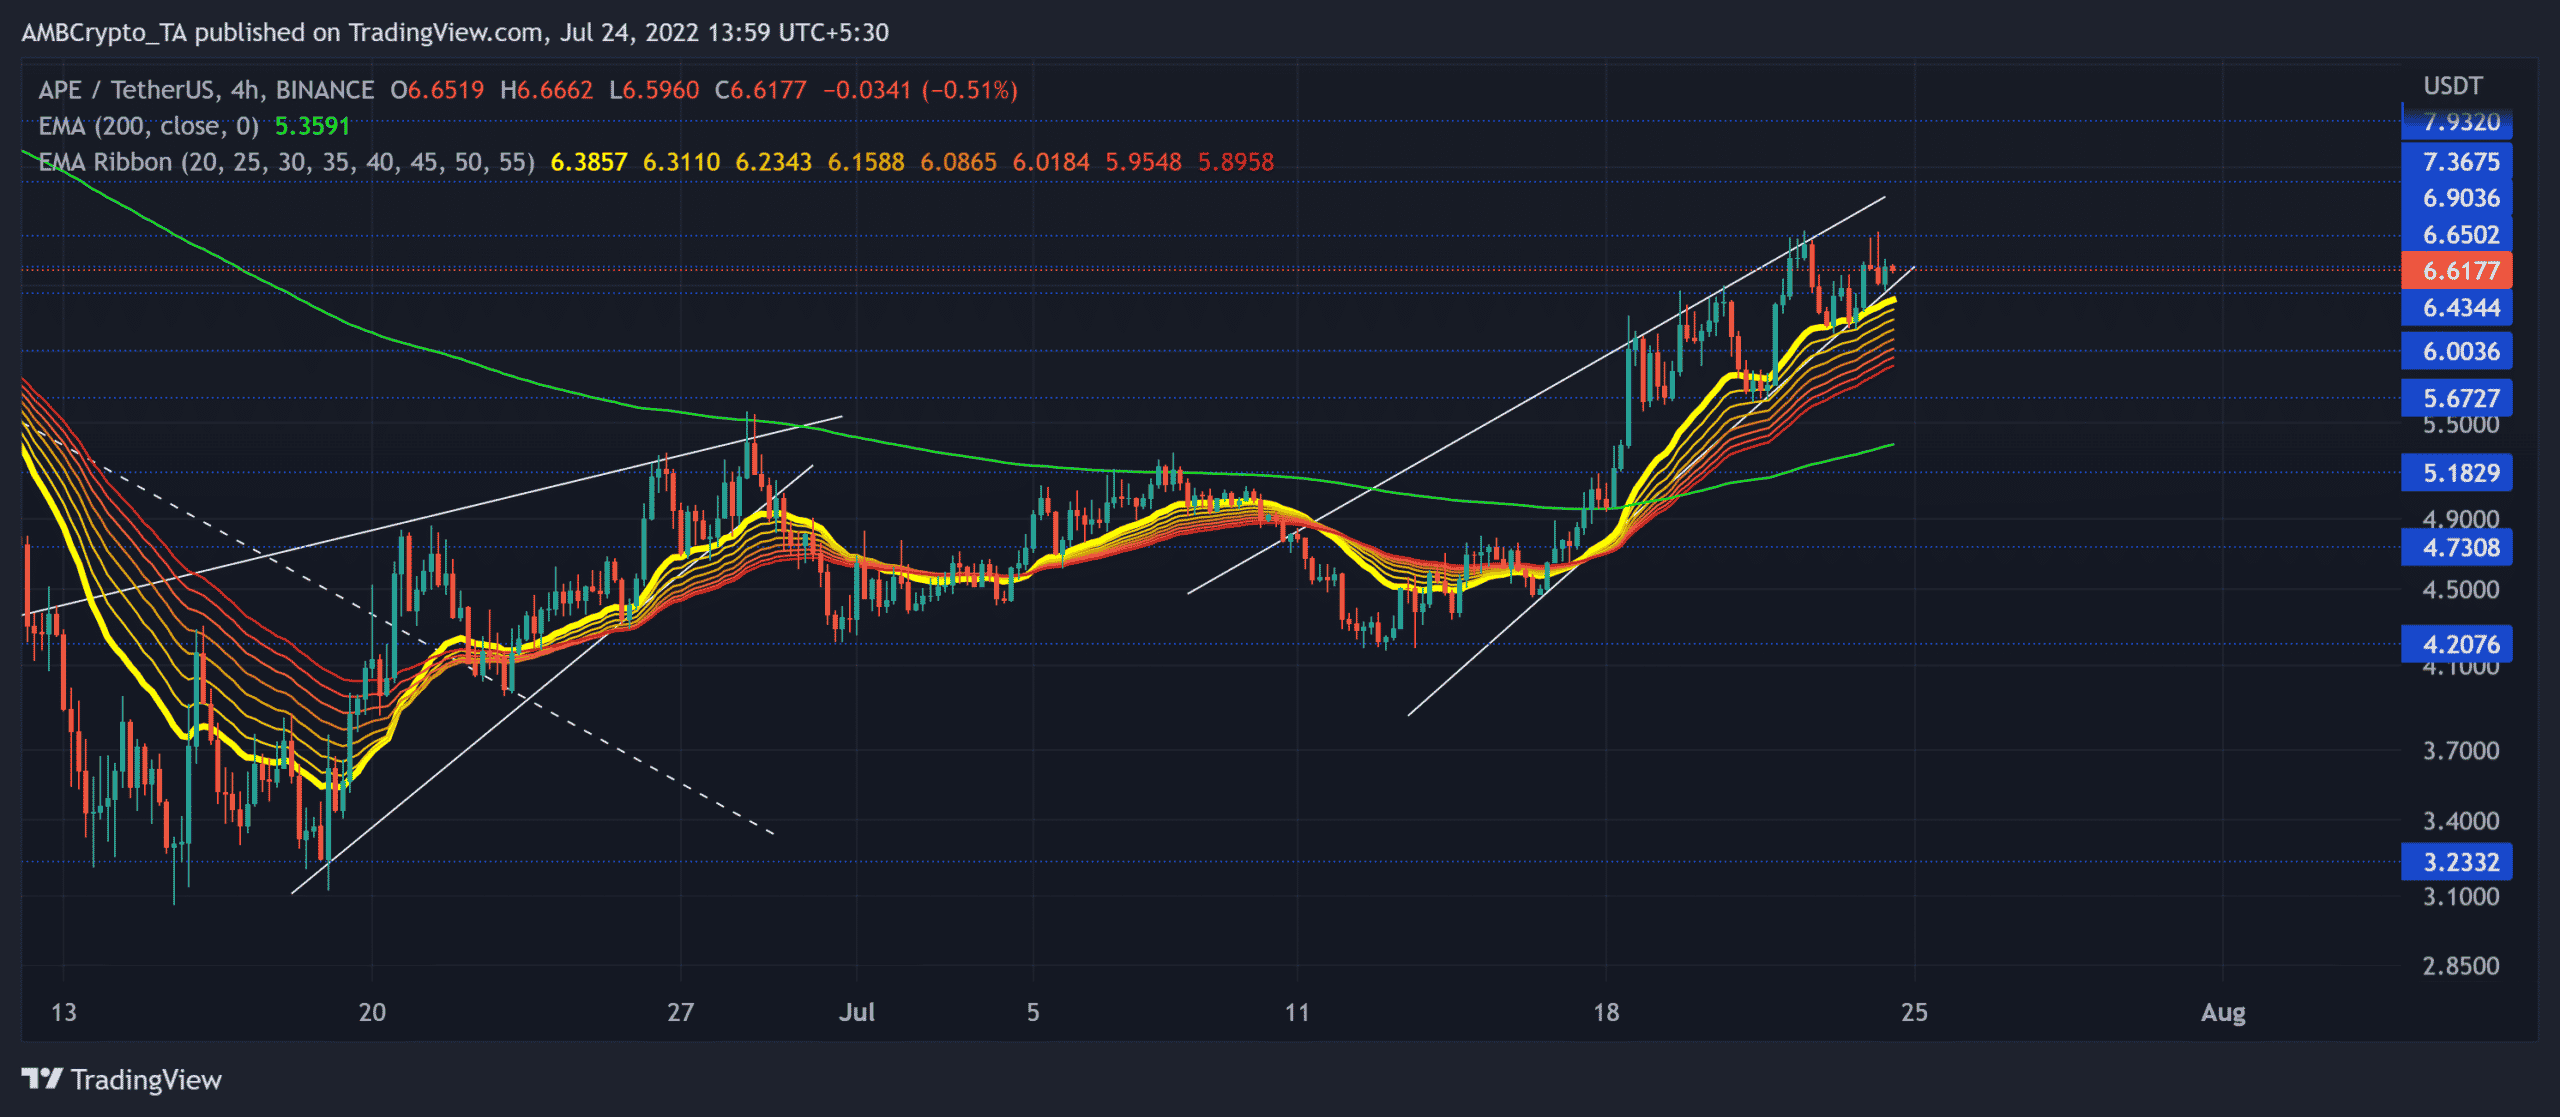
Since attaining its lifetime milestone around the $27.6-level, APE has consistently registered lower peaks over the last few weeks.
An over 88% retracement from its April highs brought APE down to find fresher lows. As a result, it poked its all-time low of $3.0661 on 15 June. The last month marked a gradual recovery on the chart.
The buyers found renewed pressure and reclaimed the previous losses by inflicting an over 105% ROI since then. This recovery entailed two rising wedges that helped APE close above the 200 EMA.
The golden cross on the EMAs has only reaffirmed the buying strength over the last few weeks. The EMA ribbons still looked north while blending with the bullish narrative.
An inability to close above the $6.6 could provoke reversal tendencies in the short term. A reversal from the $6.6-$6.9 range can cause a break below the rising wedge.
In this case, APE could see a pullback toward the $5.6-$5.8 range before a plausible buying comeback. Should the sellers dwindle, the buyers could delay this pullback.
Rationale

The Relative Strength Index (RSI) has been hovering in the bullish region while reversing from the overbought mark. A retracement toward the midline could provoke further sluggish behavior.
However, the lower peaks on the CMF and RSI affirmed a bearish divergence with the price. Also, the AO kept marking lower peaks. Any close below its equilibrium could hint at a bearish twin peak setup in the 4-hour timeframe.
Conclusion
Given the rising wedge, setup approaching the $6.6 resistance alongside the bearish divergences on the CMF and RSI, APE could see a near-term pullback. The potential targets would remain the same as discussed.
However, investors/traders should factor in broader market sentiment and on-chain developments to make a profitable move. This analysis would be imperative to identify any bearish invalidations.


